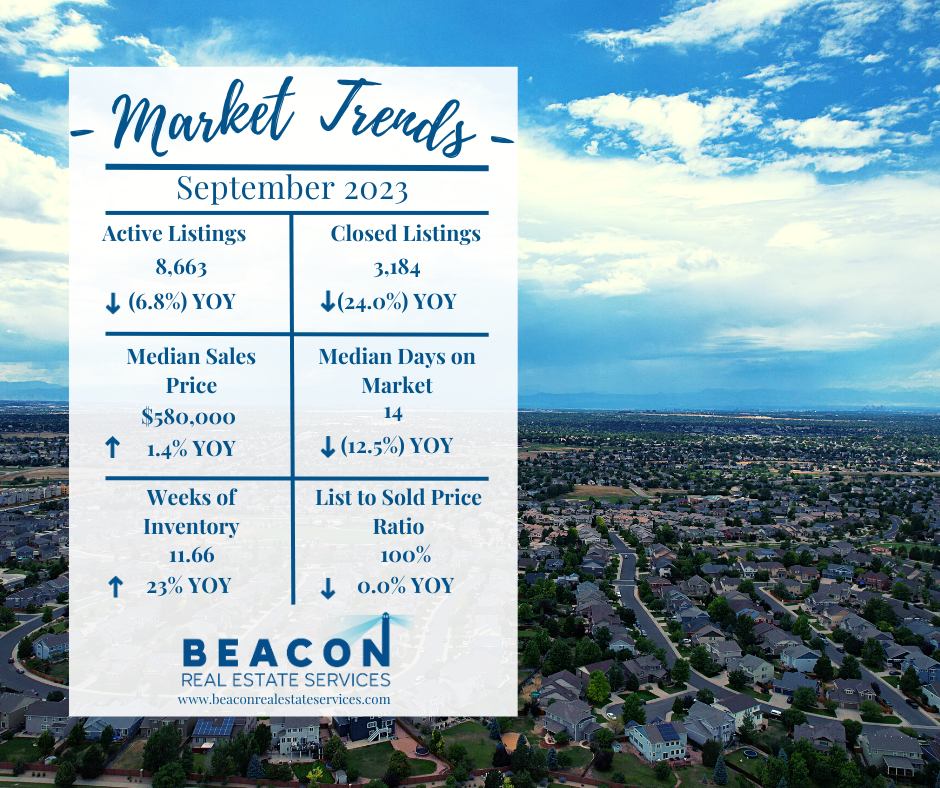
The Denver residential market is still looking good! The 10-year average for new listings is 5,815 for the month of September, but we only saw 4,869 new listings this month. With low inventory and properties going under contract quickly, the months of inventory remained at 2 months. Mortgage interest rates with a 30-year term ended September at 7.31%. Let’s dive into the key market data for Denver residential real estate market to see what is happening with supply, demand, sales prices, and months of inventory for September 2023.
Supply
In September, we had 4,869 new listings hit the market. Unfortunately, this was down (11.6%) from August and it was down (6.3%) from 2022. Usually, during September is when listings start to slow down.

The total amount of active listings at the end of the month was 8,663. Fortunately, This is up 9.6% from August 2023. The 10-year September average from 2013 to 2022 is 9,319 listings, so we are below our long-term average.
The most recent report for detached home construction starts is August 2023. The Denver Metropolitan Statistical Area (MSA) pulled permits on 896 homes. This is lower than the three year average of 954 for August. Year to date construction starts for 2023 compared to the same period in 2022 shows a (37.6%) decline.
All in all, the supply is in a better position compared to 2021 and 2022, but is still lower than 2019 and 2020.
Demand
Showings are a great leading indicator for demand in the residential real estate market. There were 45,126 showings booked through the largest showing service in the Denver metro area during the month of September.

This is down (9.1%) when compared to September 2022. The average amount of showings for September, over the last four years, is 79,283. Therefore, we have a lot few showing requests than previous years.
Denver had 3,165 properties go under contract in September 2023. This is down (14.3%) compared to August 2023 but is down (5.9%) compared to Sep 2022.
There were 3,184 closings in Sep 2023 compared to 3,803 in Aug 2023. This is a (16.3%) decrease from Aug 2023. A year ago, we had 4,190 closings in Sep 2022 so the volume of closings is down (24.0%) YOY.

The median days on market for Sep 2023 was 14 days. This means half of the properties listed are under contract in 14 days or less.
The list price to close price ratio held steady at 100%, so sellers are generally getting what they are asking. With that said, I have seen homes that are overpriced sit on the market for a long time.
All in all, demand for housing is softer when we look at showings but decent when we look at closings. Let’s look at the median sales price.
Sales Prices
The median sales price has increased every month this year, besides August and July. In September, the median sales price increased from $577,500 to $580,000. This metric includes detached and attached properties. The median price increased 0.4% over August and is up 1.4% from September 2022!

The long-term average appreciation for residential real estate is 6%. Higher prices and higher interest rates will continue to temper appreciation in the short run. Tight inventory is helping to prop up the market.
This month, prices were up 1.8% from last year! Even though September 2023 is lower than August 2023, median sales prices are still rising above Sep 2022.
Let’s look at months of inventory now.
Months of Inventory
The months of inventory is a great indicator to watch for market trends. Typically, a seller’s market has 0-3 months of inventory. A balanced market has 4-6 months of inventory, and 7+ months of inventory is a buyer’s market. In a seller’s market prices go up. In a buyer’s market prices go down.

With 8,663 listings on the market and 3,184 closings in September, the months of inventory is at 2 months or 11.66 weeks of inventory. Therefore, the inventory is still low when compared to the demand. We expect the months of inventory to continue to be low this year.
All in all, months of inventory is a great metric to watch.
Final Thoughts
In conclusion, supply, demand, median sales price, and months of inventory are ideal key performance indicators to watch for market trends. Supply is higher than the record lows of 2021 and 2022 but is still lower than the long-term average. Overall demand is there, even with higher prices and higher interest rates. We believe there is a tremendous amount of pent up demand happening right now and as soon as rates come down, more buyers will enter the market. Lastly, 2 months of inventory still quite low.
Here is the link for the full presentation: Denver Metro Residential Market Update 2023.pdf