Summer will soon be turning into Fall soon! We now have overnight lows in the 50s instead of 60s and some leaves are starting to change. What is changing in the residential real estate market? Let’s look at the trends in Supply, Demand, Sales Price, and Months of Inventory for August 2021.
Supply
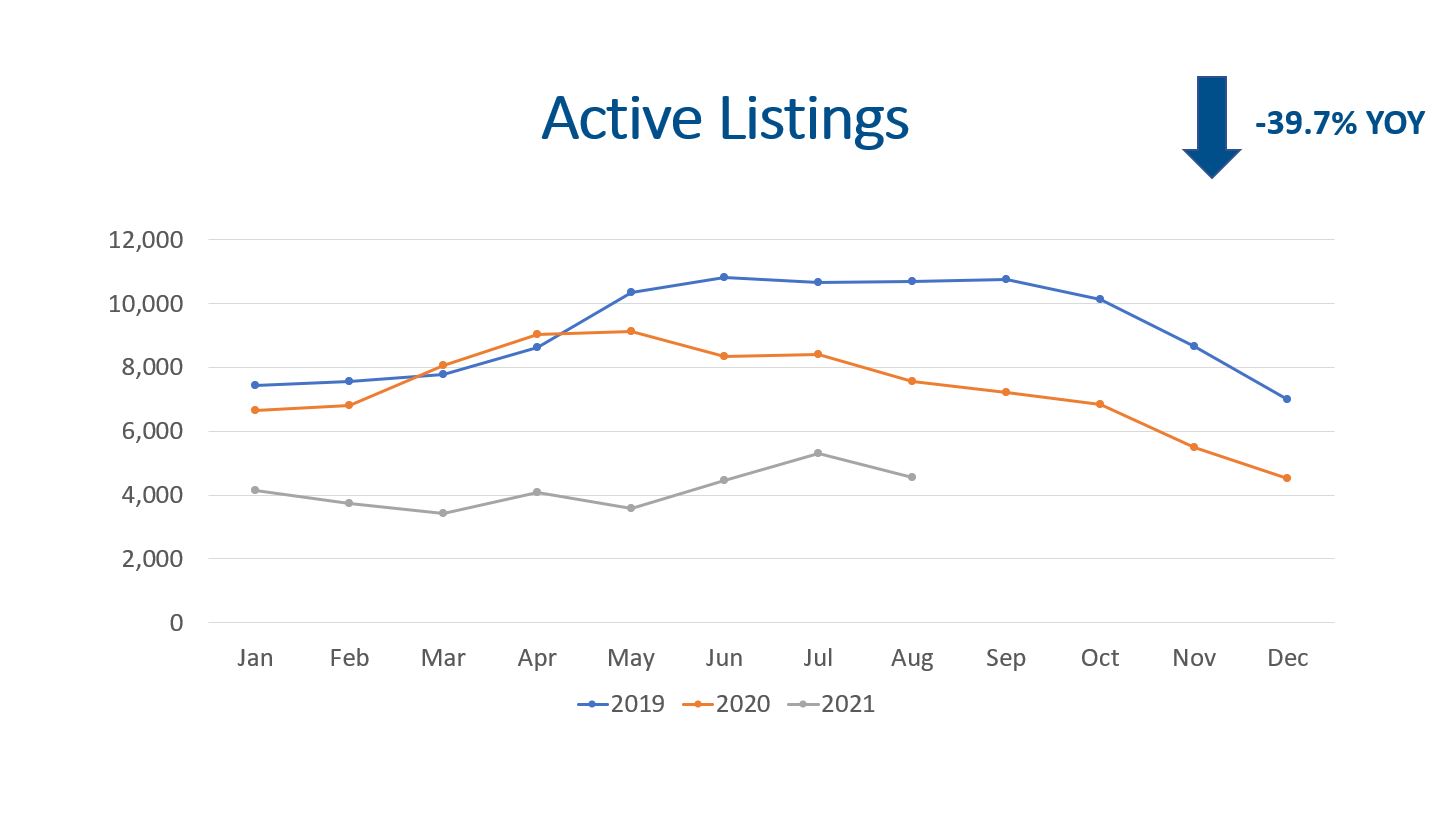
Active listings at the end of August also tells an interesting story. June and July inventory levels were trending higher but August moved lower. There were only 4,554 homes for sale at the end of the month and this represents a (39.7%) decline when compared to the 7,547 homes for sale at the end of August 2020. It is also interesting to look at August of 2019 when there were 10,684 homes for sale. We have less than half the inventory that we had two years ago.
It will take more homes consistently coming on the market in order for price appreciation to moderate.
Demand
Due to fluctuations in inventory, it is better to look at the showings per active listing. The showings per active listing came in at 11.95 for the Denver Metro Area. This is just a little higher than the 11.15 showings per active listing in August 2020. Although this is down from the 22.25 showings per active listing in February, it is important to understand that the first half of 2021 was dramatically higher than 2019 and 2020.
There were 6,093 properties that went under contract in August 2021. The trendline for properties going under contract in 2021 is following 2019 closely.
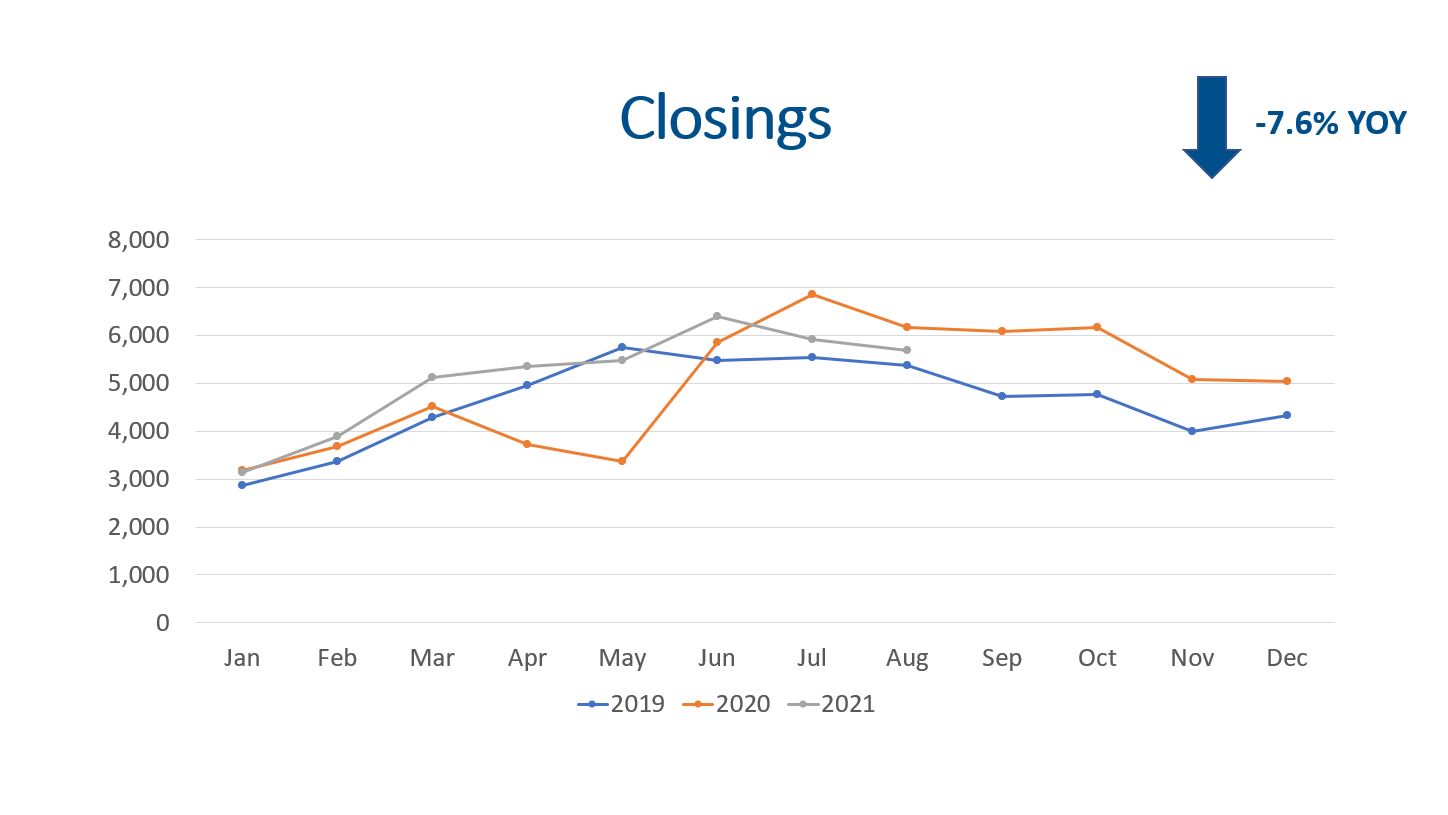
There were 5,693 closings during August. Again, this volume is lower than August 2020 but is very similar to 2019. The last half of 2020 was higher than it should have been because a lot of the Spring sales moved into Summer sales driven by the lockdowns.
The median days on market is at 5 days, which is very low. This does make sense when we consider the low supply and strong demand.
All in all, showings, contracts, closings, and the median days on market indicate that we are still in a seller’s market!
Median Sales Price
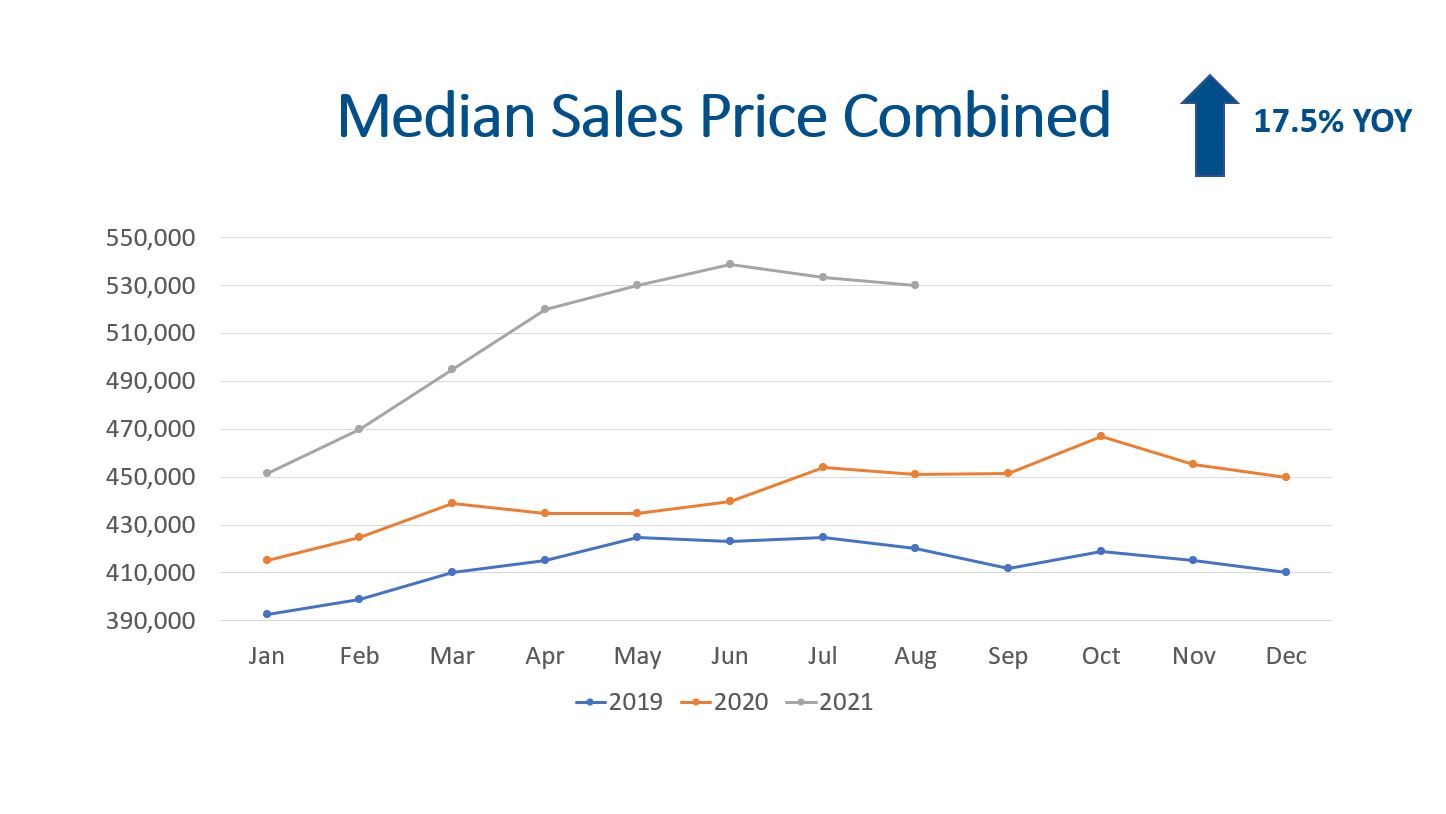
The median sales price for August was $530,000. This represents a slight dip of 70 basis points compared to July of 2021, but we are still 17.5% higher than August of 2020 for the market as a whole.
When we specifically look at detached single family homes, the median sales price is $580,000! This is 16% higher than August of 2020 and 28.9% higher than August of 2019.
The basic economics mentioned above with low supply and strong demand are a recipe for price appreciation. This is great for everyone who owns real estate but it has been challenging for first-time homebuyers.
Months of Inventory
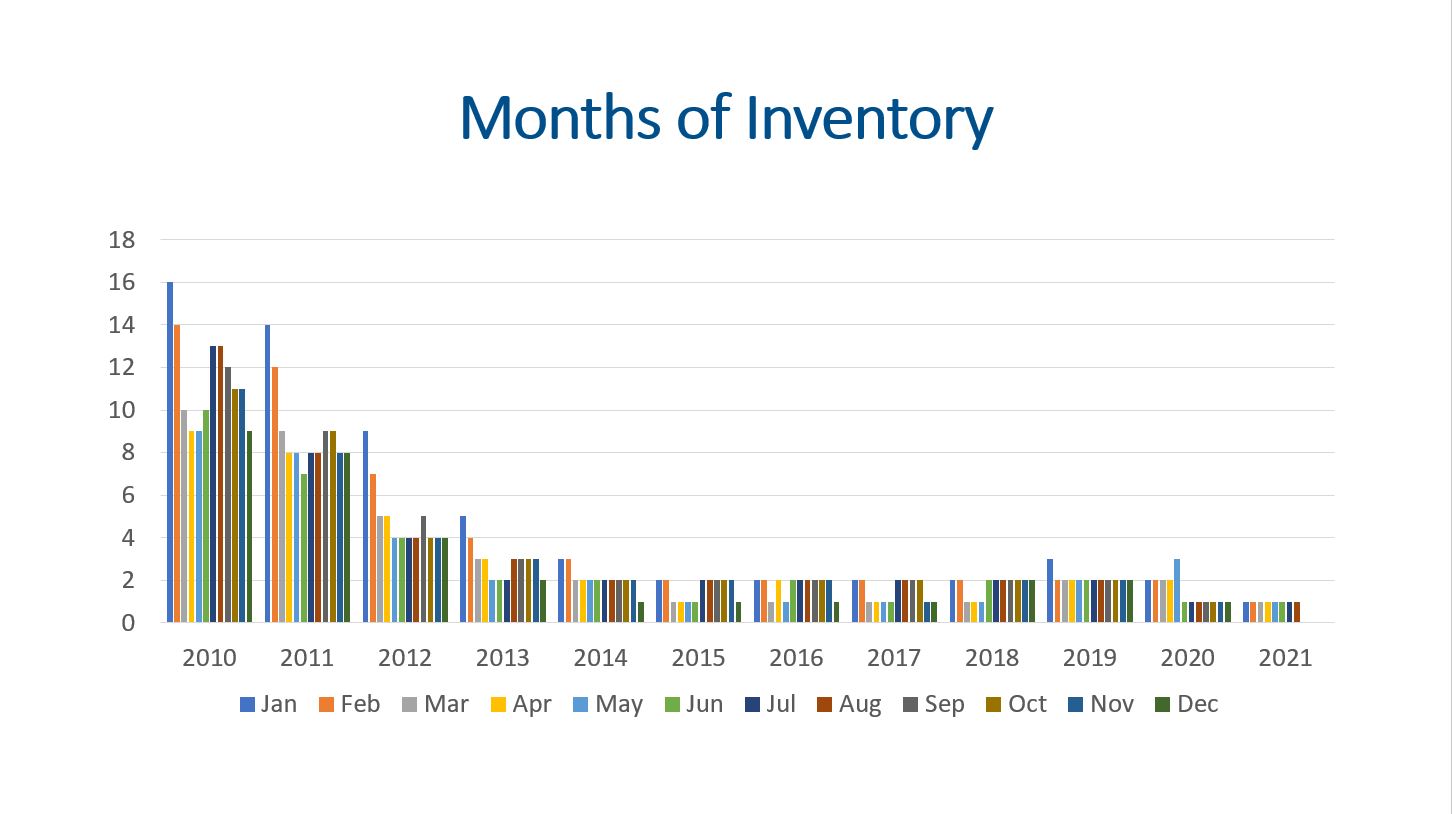
With 4,554 listings on the market and 5,693 closings, we have 3.4 weeks of inventory. This is still low inventory. The market is competitive, so buyers need to be decisive and move quickly if they want to buy a home.
Final Thoughts
In summary, supply, demand, median sales price, and months of inventory are all great key performance indicators telling us a lot about the residential real estate market. Supply has been tightening for the last 11 years, and demand has been steadily increasing. This is why the median sales price has continued to climb. Prices have nearly doubled in the last 10 years! As long as the months of inventory is below 3 months, we expect prices to increase. With that said, we believe home appreciation will moderate some over the next 12 months to high single digits.
Here is a link to the full presentation:
