The residential real estate market is shifting some more. The 30-year mortgage rate hit 6% in June, pulled back to 5.3% in July, and ended August at 6%. I received a rate update this week at 6.5%. Five months ago we had sellers with 30-40 showings and 10+ offers. Now we are seeing extended marketing times and offers from buyers contingent on a home selling that isn’t even on the market! What a difference in such a short period of time!!!
In traditional monthly fashion let’s dive into the key market data for the Denver residential real estate market through: Supply, Demand, Sales Prices, and Months of Inventory for August 2022.
Supply
We saw 5,468 new listings during August 2022. This was 970 fewer new listings than the 6,438 new listings than in July 2022. We do typically see a seasonal slowdown in new listings from August to December with the trend reversing in January.
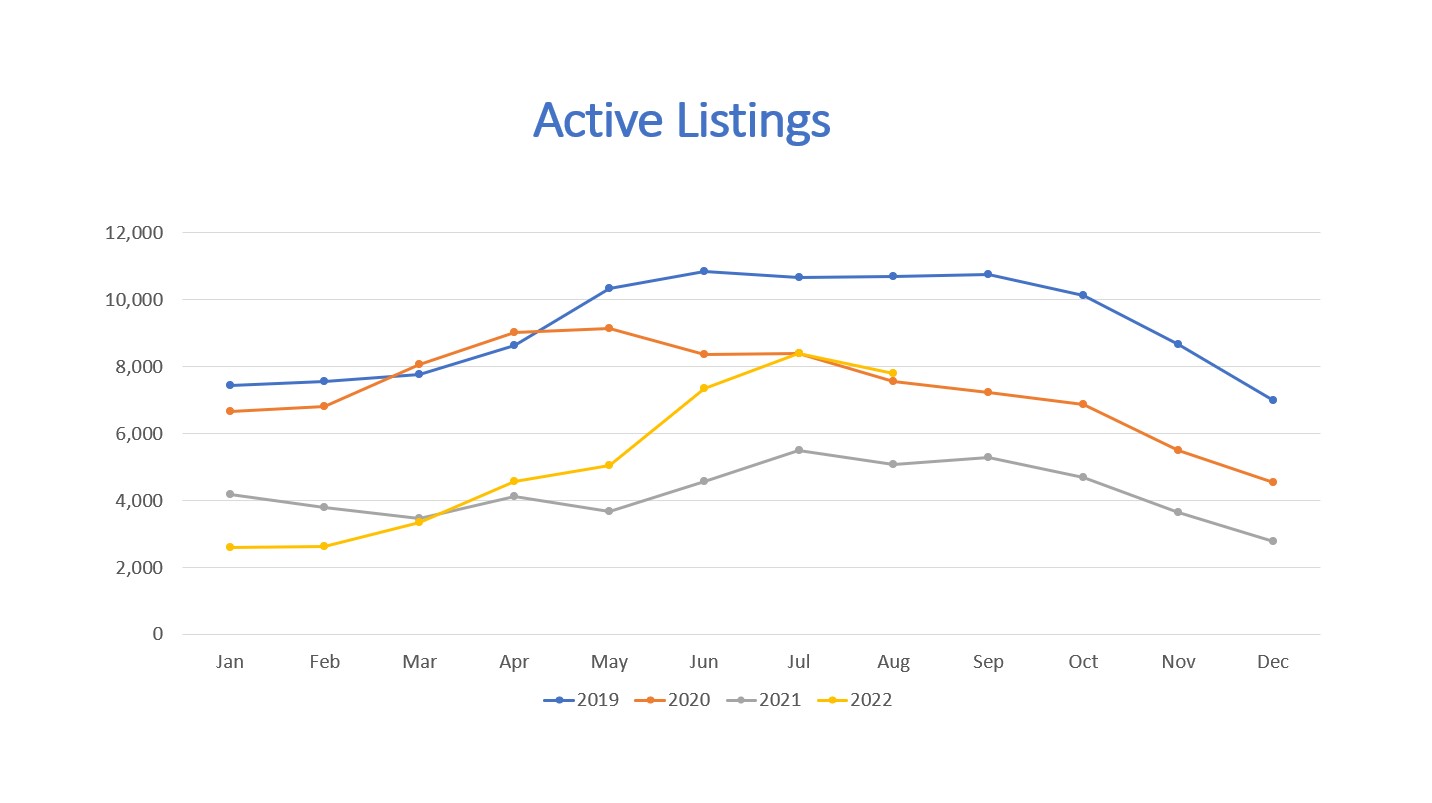
When we look at the total amount of active listings at the end of the month, we had 7,795 active listings. The inventory is up 53.8% compared to a record low of 5,069 listings in August 2021. The current inventory is very close to the levels we saw in 2022 but are still much lower than 2019. This has been a welcome change for buyers.

Year to date detached single-family home construction starts, for the Dener Metropolitan Statistical Area (MSA), are down (36.3%) compared to 2021 but are up 11.9% compared to 2020. We believe the higher prices and higher interest rates will continue to slow new construction.
All in all, supply for residential homes for sale is still low historically speaking.
Demand
The average total showings for August during 2019, 2020, 2021 was 98,825. August 2022 had 55,908 showings (roughly 56.6% of what we should have)! Higher home prices, higher rents, higher interest rates, high inflation, and overall market uncertainty appears to have taken a large portion of buyers out of the market.
We saw 4,602 properties go under contract in August 2022. This is a (20.6%) decrease compared to August 2021 but is a 12.9% increase compared to July 2022.
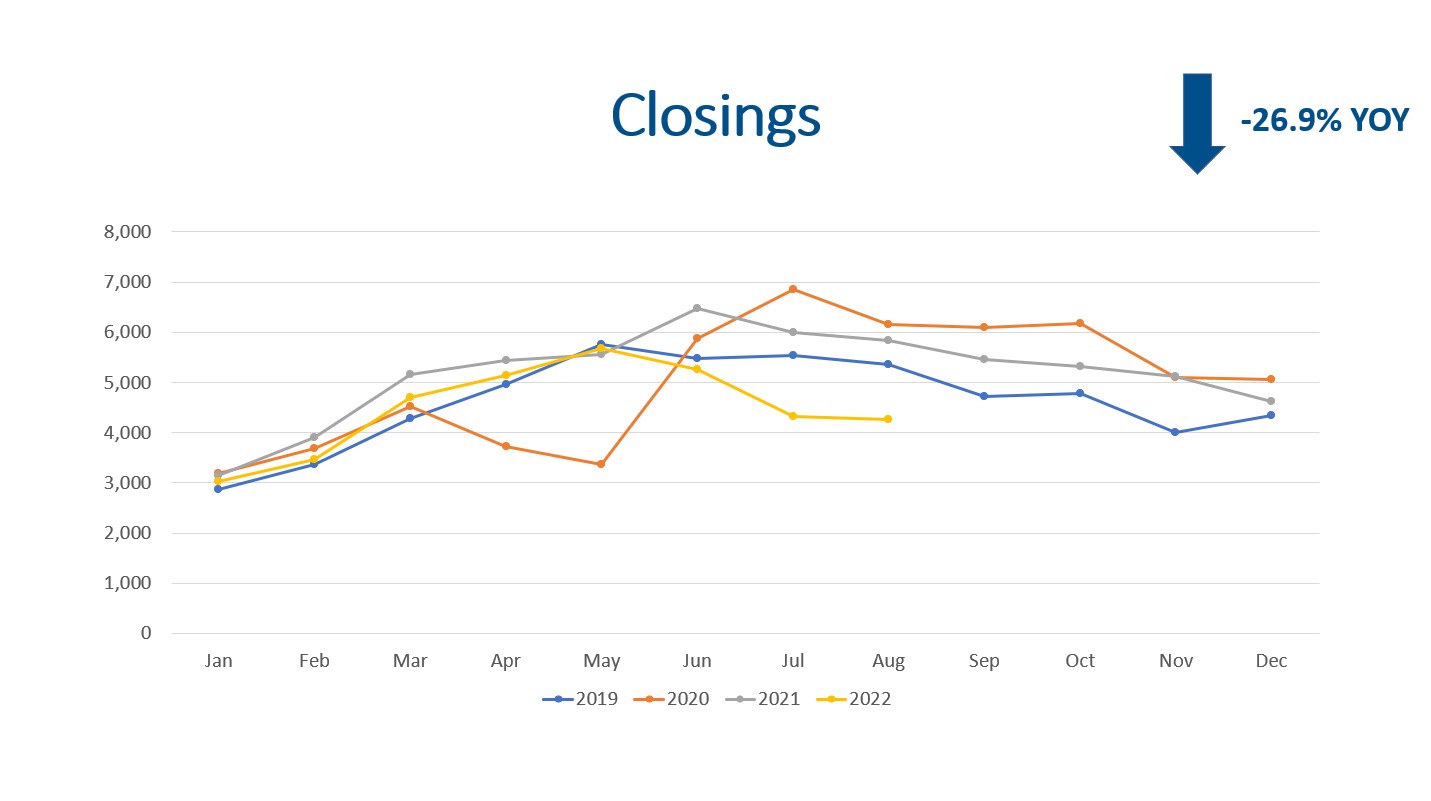
There were 4,267 closings in August 2022 compared to 4,323 in July 2022. This is an (1.3%) decrease month over month. A year ago we had 5,837 closings, so closing volume is down (26.9%) YOY. Year to date, there have been 35,871 closings compared to 41,553 closings during the same period in 2021. This represents an overall decline in closings of (13.7%).

The median days on market for August 2022 was 11 days. This only counts the properties that have closed so as more homes sell that had longer marketing times, this figure will increase.
All in all, the Federal Reserve’s plan to tame inflation by raising rates has put out the flaming hot residential real estate market. Now the Fed needs to figure out how to put out the inflation fire in other areas of the economy.
Sales Price
The median sales price for the residential market for August was $575,000. This is down the median sales price of $590,000 in July. This includes detached homes, condos, and town homes.
If we look just at detached homes, the median sales price was $640,000. This is $10,000 less than July but still represents a 10.3% YOY increase.
We believe appreciation will return to the long-term average of 6% soon.
Months of Inventory
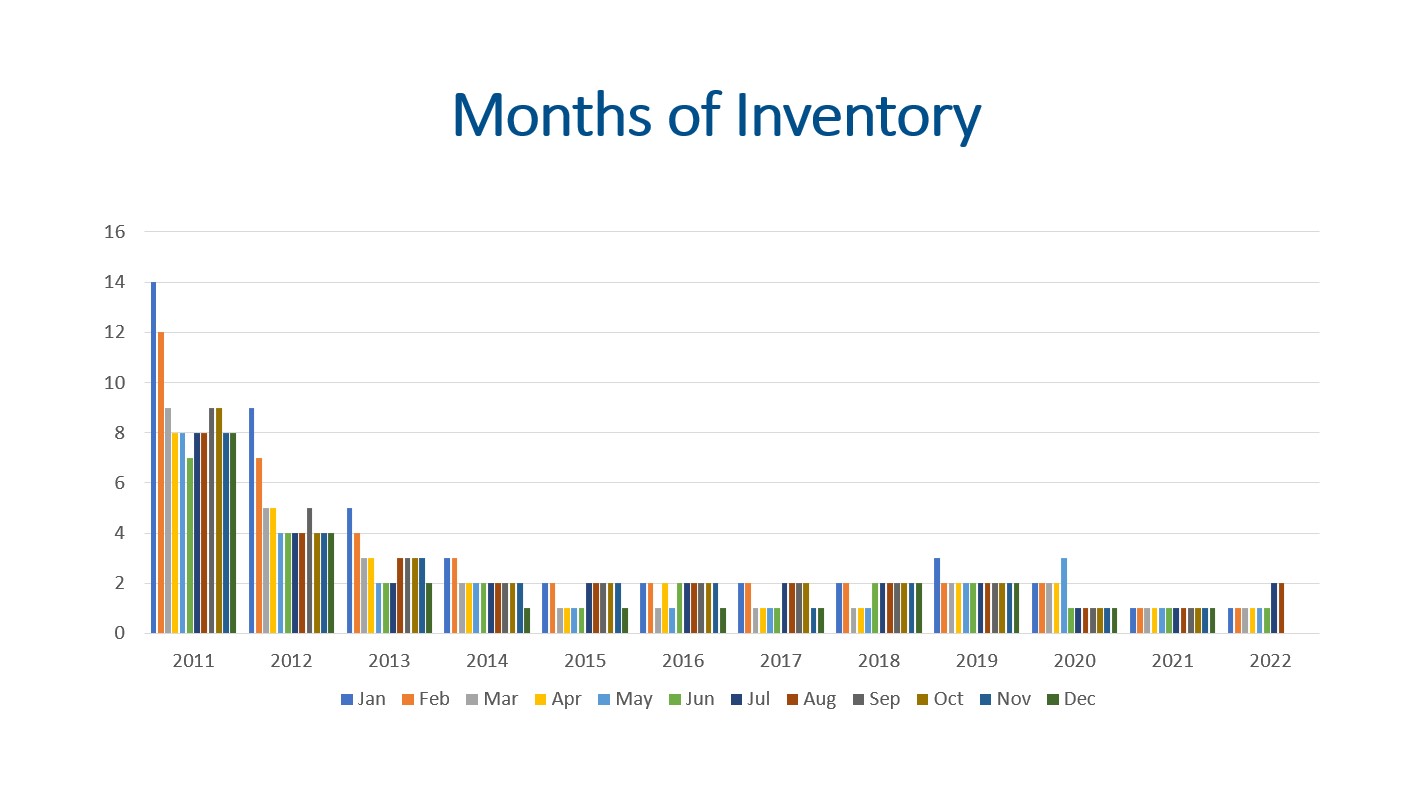
The months of inventory is still one of the best indicators to watch for market trends. A seller’s market has 0-3 months of inventory. A balanced market has 4-6 months of inventory, and 7+ months of inventory is a buyer’s market. In a seller’s market prices go up. In a buyer’s market prices go down.
With 7,795 listings on the market and 4,267 closings, we have 7.83 weeks of inventory. This is down slightly from 8.32 weeks in July but up considerable from the 3.04 weeks in March of 2022.

Final Thoughts
In summary, supply, demand, sales prices, and months of inventory are all important key performance indicators worth monitoring closely. Supply is low but not as low as it was. Demand is weakening. Higher prices, higher rents, higher interest rates, high inflation, and uncertainty in the economy is slowing showings, new contracts, and now closings. The 30-year mortgage interest rate is the highest it has been since 2008. Lastly, with 7.83 weeks of inventory, annual home appreciation will continue slowing and may give back some of the gains.
Here is a link to the full presentation: