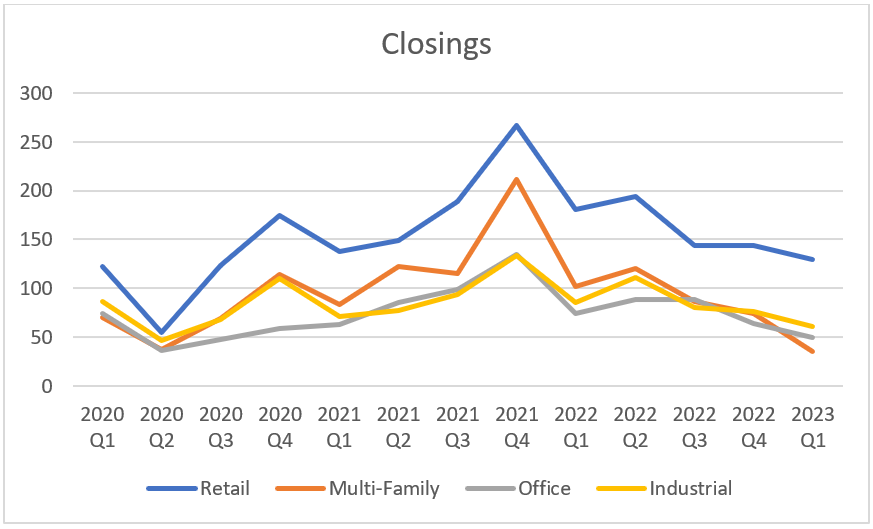
Denver Commercial Real Estate market saw another significant slowdown in sales transaction volume in Q1 2023 compared to Q1 2022 and Q4 2022. The four major property types saw a combined volume of 275 sales compared to 442 last year and 358 in Q4 2022. Year over year, the volume is down (37.8%) for Q1 and is down (23.2%) compared to Q4 2022.
The four commercial property types we are tracking are: retail, multi-family, office, and industrial. It is interesting to look at the Commercial Real Estate Market as a whole and the individual property types. Let’s dive into supply, demand, new construction, vacancy rates, and rent growth for Denver Commercial Real Estate. 
Supply
There are 853 active listings across the four major property types with 313 retail, 116 multi-family, 252 office, and 172 industrial. Throughout 2022, we average 851 commercial listings at the end of each quarter. It is worth noting that the Denver MSA has 29,663 buildings totaling 843M sf of space. Most of the new construction is in multi-family and industrial with retail and office growing by modest amounts. Let’s take a look demand.
Demand
Demand for commercial space is created by people and businesses using the space. When our population is growing, there is an increased demand for housing and shopping. When jobs are created, there is more demand for industrial and office; however, office demand has been decreasing due to the pandemic and remote work.

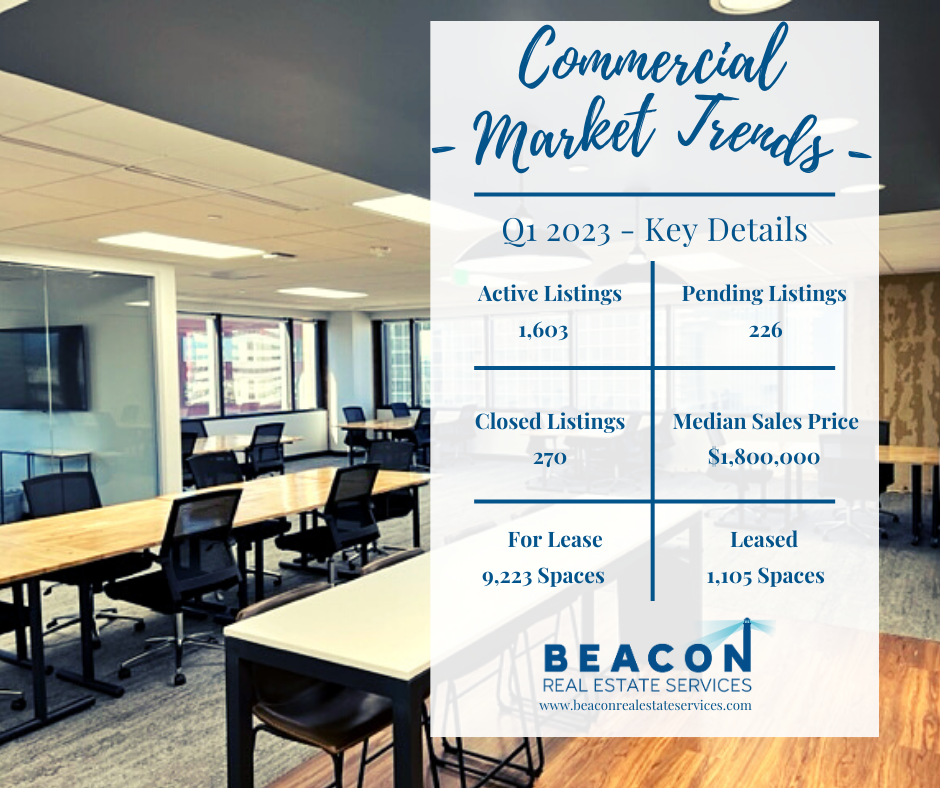
There were 270 closed sales in Q1 2023, which is down from 442 closed sales in Q1 2022. This represents a decline of (37.8%). The total dollar volume for retail, multi-family, office, and industrial was $1.14B in Q1 2023 compared to $2.5B in Q1 2022. The dollar volume was more than cut in half because there were fewer large transactions.
Another gauge for demand is net absorption. Absorption is a gauge of the space tenants need to live or operate their businesses. In Q1 2022, Denver absorbed 2M sf, but Q1 2023 saw only 986k sf of absorption. Let's take a look at new construction in the various property types.
New Construction
Developers started construction on 5M sf during Q1. This is down some from the 5.75M sf started during Q4. Retail construction starts accounted for 34K sf. Multi-family construction starts were 1.85M sf. Office construction starts were 922K sf, and industrial construction starts accounted for 2.2M sf.
Another factor to consider is the total sf of space under construction. Retail has 510K sf under construction. Multi-family has 24.3M sf (30,213 units) under construction. This is the most amount of apartments in the 22 year history. Office has 3.4M sf under construction, and industrial has 8.3M sf under construction. All together there is 33.3M sf of Commercial Real Estate under construction in Denver. Industrial has 9M sf under construction.
Developers delivered just over 3.6M sf in Q1 2023, which is close to what was delivered in Q4 2022. Retail delivered 249K sf. Multi-family developers completed 1.45M sf. Office developers delivered 32.6K sf. Industrial developers delivered 1.9M sf.
Next, let’s look at vacancy rates to see how much space is not occupied.
Vacancy Rates
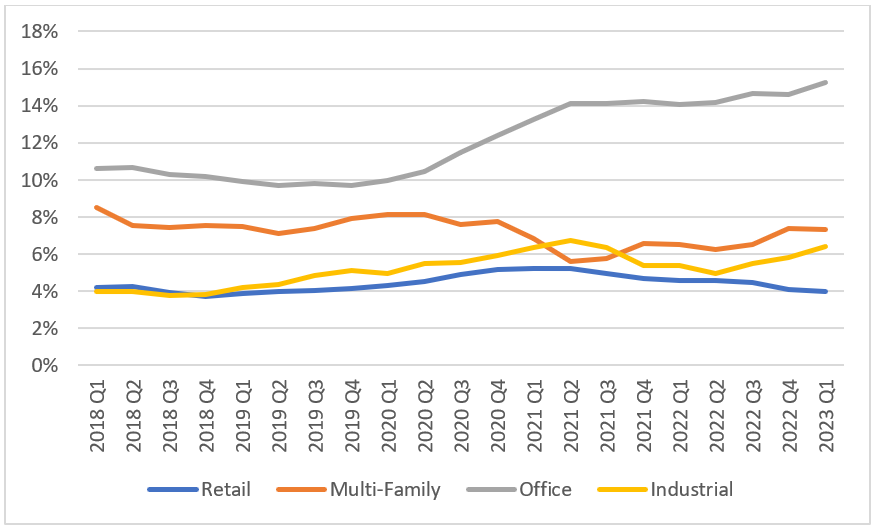
A vacancy rate is a metric comparing the amount of unoccupied sf to the total sf of all the buildings in a market. Denver has 68.4M sf of vacancy for commercial real estate. Although this sounds like a lot, Denver has 843.5M sf of commercial buildings. Therefore, our commercial vacancy rate is 8.1%.

If we are to understand commercial, we need to compare the current vacancy rates to the long-term vacancy rates. Multi-family and industrial properties are very close to their long-term average. Retail is nearly 2% below the long-term average. Office is 3% higher than the long-term average. Next let’s look at rent growth.
Rent Growth
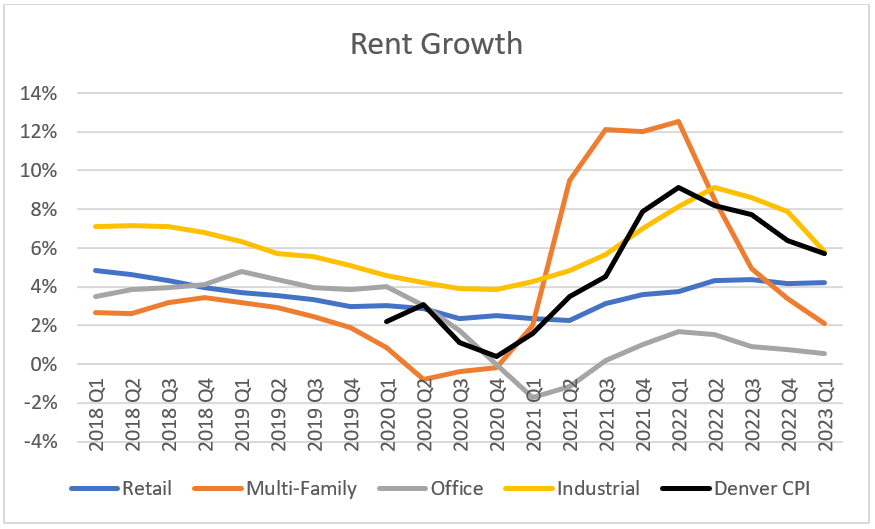
Rent growth could be lumped into demand but it is interest enough to separate into a new paragraph. Industrial YOY rent growth matched the Denver CPI (inflation) in Q1 2023, but all other commercial property types did not keep up with inflation. Retail rents grew 4.2%, multi-family rents grew 2.1%, and office rents grew 0.6%. Multi-family rents grew faster than inflation from Q1 2021 to Q2 2022 which spurred the huge growth in multi-family development.

Final Thoughts
In Summary, supply, demand, new construction, vacancy rates, and rent growth are all good key performance indicators for the commercial real estate market in Denver. We have a decent supply of properties for sale. The single largest challenge is finding the right property in the right area for both investors and owner users. Demand for properties softened significantly during Q1. Developers are hard at work building multi-family and industrial properties. Developers aren’t building much retail and office. Vacancy rates are fairly similar across the commercial property types with the exception of office. Office has been consistently higher for several years now, and we expect office to stay higher for the foreseeable future. Lastly, rent growth for multi-family and industrial has outpaced inflation but multi-family has been lower than inflation for the last four quarters. Please reach out to Justin Reyher or Stephanie Ahle with any questions by phone or email.
Here is a link to the full presentation for each property type:
Denver Commercial Real Estate Retail 2023 Q1.pdf
Denver Commercial Real Estate Multi-Family 2023 Q1.pdf
Denver Commercial Real Estate Office 2023 Q1.pdf
Denver Commercial Real Estate Industrial 2023 Q1.pdf
Author:
Justin Reyher
Managing Broker at Beacon