Denver Commercial Real Estate market saw a slowdown in sales volume and transactions in Q4. Although inflation is still higher than the 2% target set by the Federal Reserve, higher interest rates and economic uncertainty are weighing on the markets. The four commercial property types we are tracking are: retail, multi-family, office, and industrial. It is interesting to look at the big picture but also how each property type is performing. Let’s dive into supply, demand, new construction, and vacancy rates for Denver Commercial Real Estate.
Supply
There are 953 active listings across the four major property types. The 320 retail listings range from a 387 sf storefront on Downing for $249,228 to a 64,400 sf, 6.43 acre, neighborhood center in Aurora for $15,794,000. The 106 multi-family properties range from a 7-unit building in Lincoln Park outside of Downtown for $715,000to a 68-unit apartment building for $17,000,000 in North Aurora. The 258 office properties range from a 962 sf condo for $240,500 in Greenwood Village to a 267,117 sf building on 12 acres in Thornton for $30,000,000. Lastly, the 169 industrial properties range from a 1,200 sf condo in Westminster for $407,760 to a 100% leased 144,024 sf manufacturing facility in Thornton for $18,500,000.
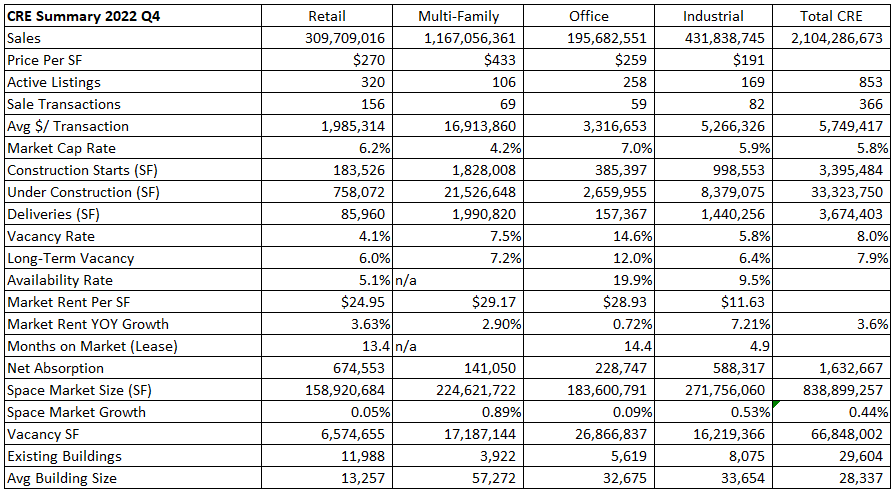
Below is a table of the key performance indicators we are monitoring.
Demand for commercial space is created by investors and businesses using the space.
Demand
There were 366 closed sales in Q4, which is down from 547 closed sales in Q3 2022. The total dollar volume for retail, multi-family, office, and industrial was of $2.1B with over half of the sales volume coming from multi-family. The average transaction was $5.75M. Among the four property types: retail accounted for 156 sales, multi-family accounted for 69 sales, office accounted for 59 sales, and industrial accounted for 82 sales. The monthly absorption rate was 122 sales; therefore, we have 6.9 months of commercial inventory.
Another gauge for demand is net absorption. Absorption is a gauge of the space tenants need to operate their businesses. Retail gained 674,553 sf of occupancy. Multi-family gained 141,050 sf of occupancy. This seems very low, so we are questioning the data. Office gained 228,747 sf of occupancy, and industrial gained 588,317 sf. We were surprised to see such strong leasing in retail. It is good to see office with positive absorption because we are down (5.8M) sf since Q1 2020.
Investors look at capitalization rates (cap rates) when they are investing. A cap rate is what an investor is the expected return when comparing net operating income (NOI) to the purchase price. For example, if an investor wants $5 of NOI, and they are willing to pay $100 for the $5 income, the capitalization rate would be 5% (NOI / value = cap rate). The Denver area currently has average cap rates ranging from 4.2% to 7.0% for stabilized assets depending on the property type. This measure is a really broad stroke of investment performance. With commercial mortgage rates in the 7% to 8%, some of these assets would be producing negative leverage (where the cost to borrow money is higher than the return). We expect cap rates to increase which means the price an investor is willing to pay will be less.
Let's take a look at new construction in the various property types.
New Construction
Developers started construction on 3.9M sf during Q4. This is down some from the 4.1M sf started during Q3. Retail construction starts accounted for 183K sf. Multi-family construction starts were 1.8M sf. Office construction starts were 385K sf, and industrial construction starts accounted for 999K sf.
Another factor to consider is the total sf of space under construction. Retail has 758K sf under construction. Multi-family has 21.5M sf (26,708 units) under construction. This is the most amount of apartments in the 22 year history. Office has 2.7M sf under construction, and industrial has 8.3M sf under construction. All together there is 33.3M sf of Commercial Real Estate under construction in Denver.
Developers delivered just over 3.7M sf in Q4 compared to 4.6M sf during Q3. Retail delivered 86K sf. Multi-family developers completed nearly 2M sf. Office developers delivered 157K sf. Industrial developers delivered 1.44M sf.
Next, vacancy rates tell us how much space is not occupied.
Vacancy Rates
Vacancy rates for Denver Commercial Real Estate are different than some may expect. A vacancy rate is a metric comparing the amount of unoccupied sf compared to the total sf of all the buildings in a market. Denver has 66.8M sf of vacancy for commercial real estate. This sounds like a lot but Denver has 838.9M sf of commercial buildings. Therefore, our commercial vacancy rate is 8%.
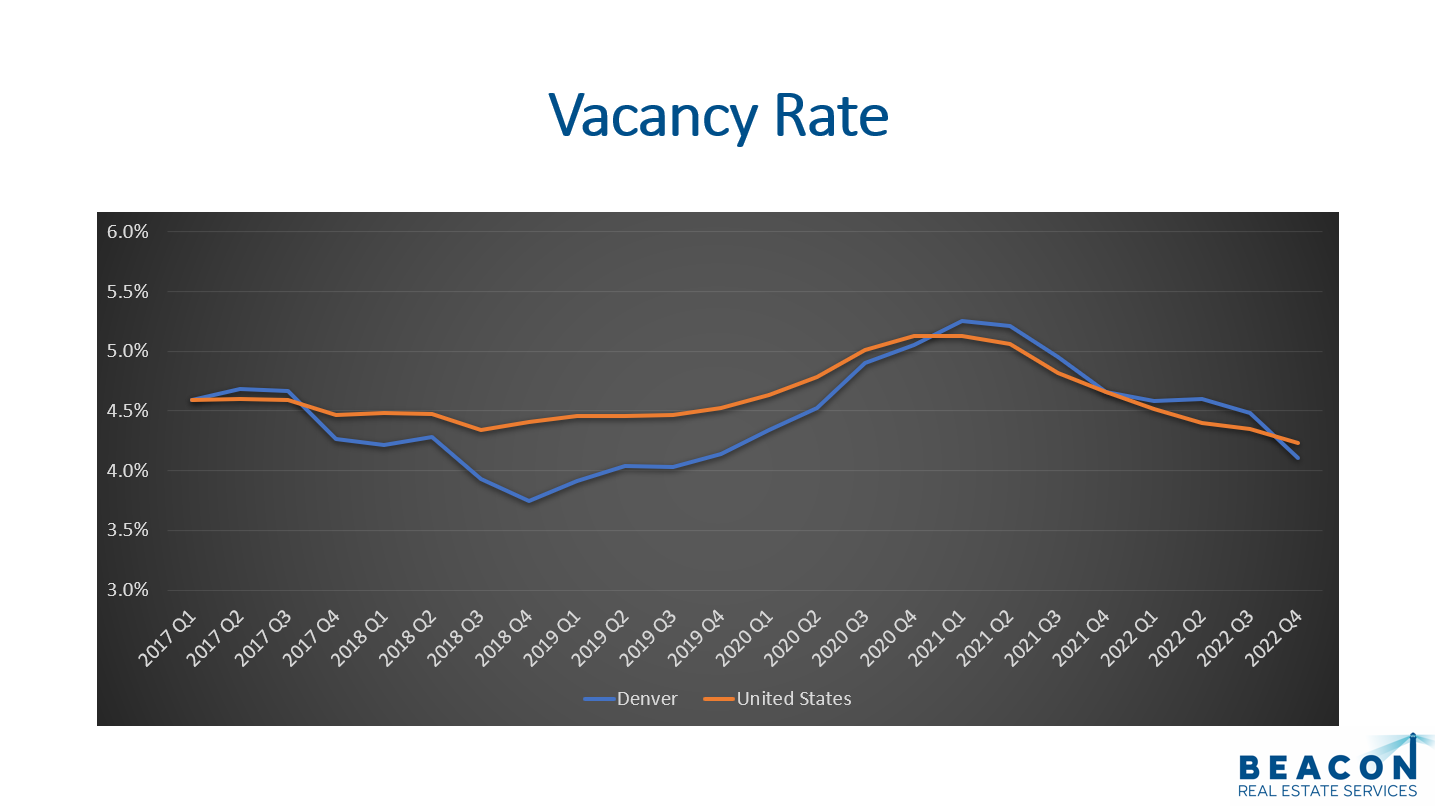
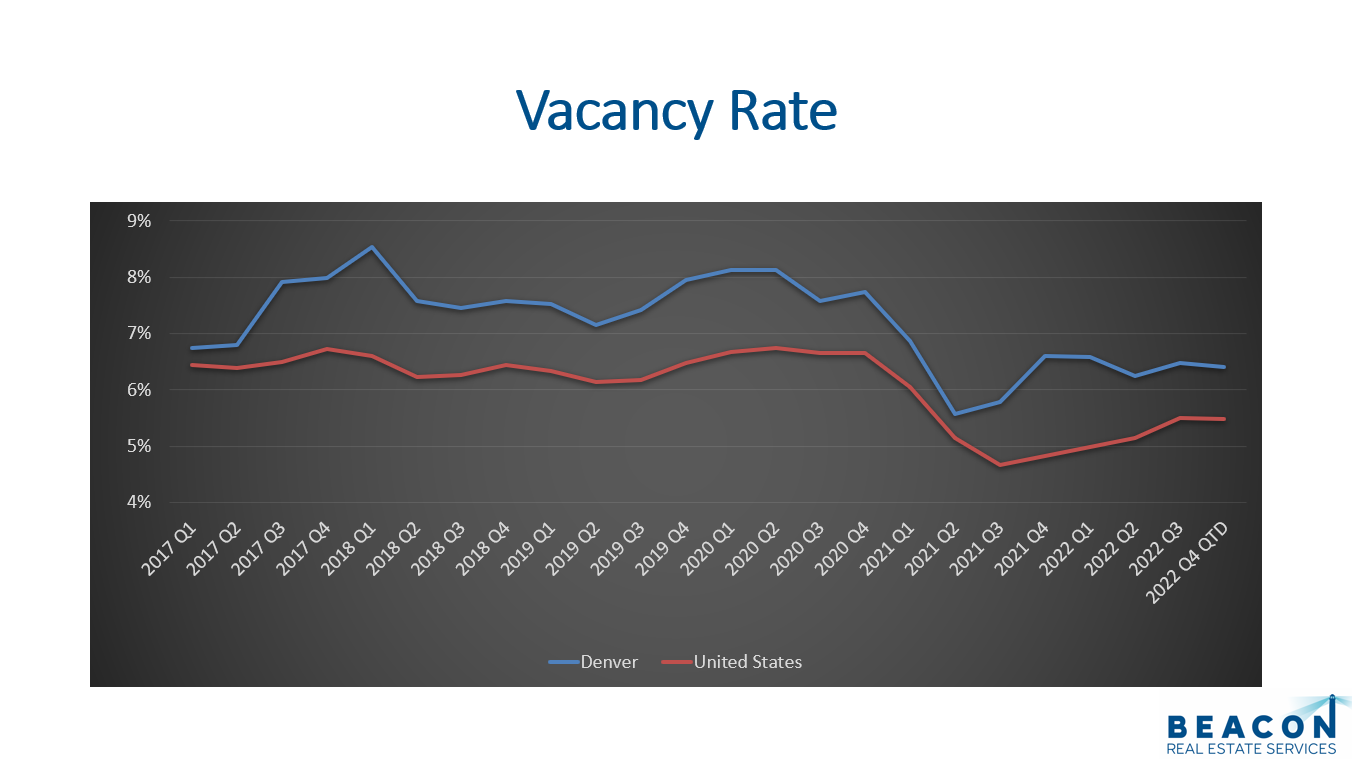
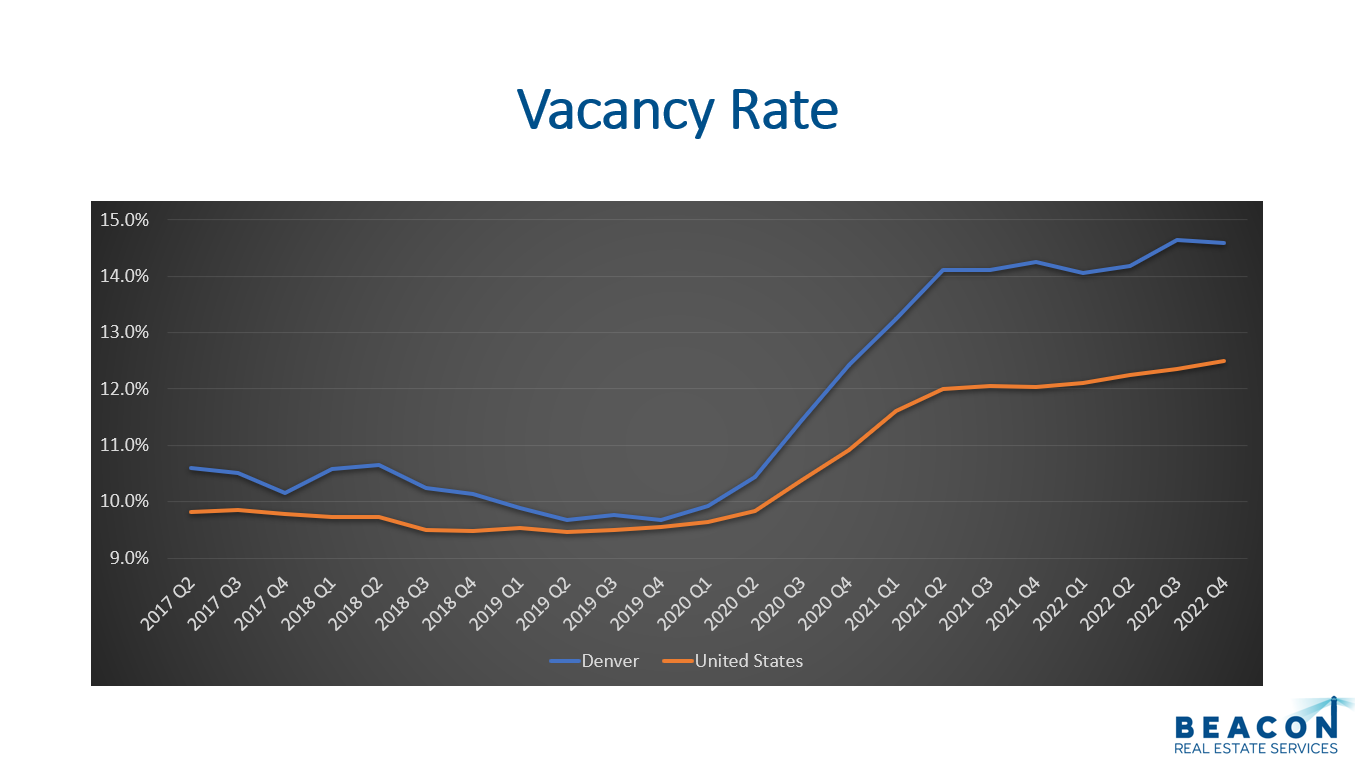
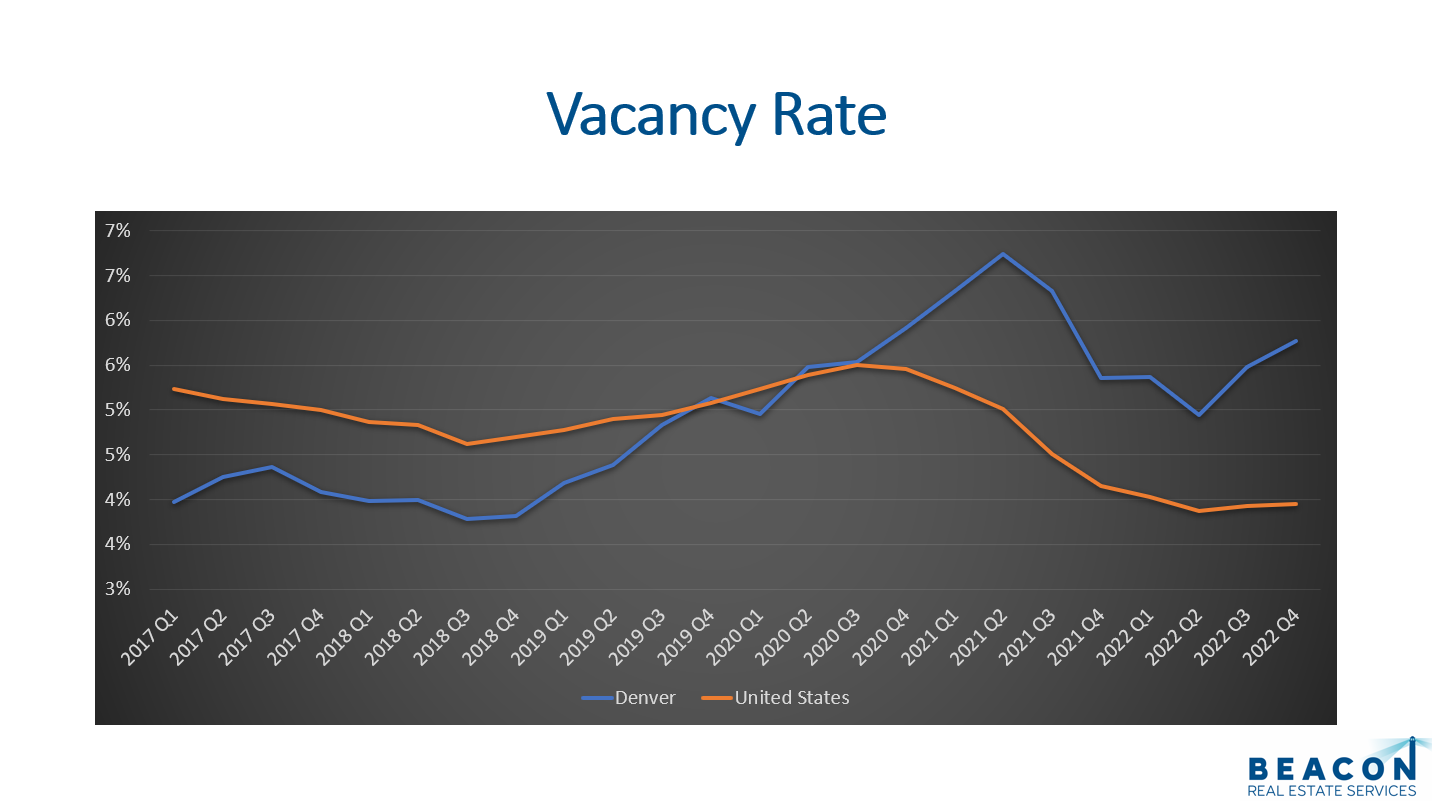
If we are to understand commercial, we need to compare the current vacancy rates to the long-term vacancy rates. Retail properties have a vacancy rate of 4.1% compared to a long-term rate of 6.0%. Multi-family has a current rate of 7.5% compared to a long-term rate of 7.2%. Office properties have a vacancy rate of 14.6% compared to a long-term vacancy of 12%. Lastly, industrial has a current rate of 5.8% compared to a long-term rate of 6.4%.
Three of the property types are performing better than the long-term average. The only property type with a vacancy rate exceeding the long-term vacancy rate is office.
Retail
 Multi-Family
Office
Industrial
Final Thoughts
In Summary, supply, demand, new construction, and vacancy rates are all good key performance indicators for the commercial real estate market in Denver. We have a decent supply of properties for sale. The challenge is finding the right property in the right area for both investors and owner users. Demand for properties is softening some as the months of inventory increased to 6.9 months in Q4 compared to 4.95 months in Q3. Developers are hard at work building all over the city. Vacancy rates are fairly similar across the property types with the exception of office. Office has been consistently higher for several years now.
Here is a link to the full presentation for each property type: