Industrial commercial real estate in Denver is very interesting to watch. Many reports show a massive increase in e-commerce during 2020 as more and more purchases were made online. This is one of the driving factors behind the health in the industrial market. Also, companies are expanding their distribution and logistics facilities to get product closer to the end users. Let’s dive in and review some of the metrics.
Supply
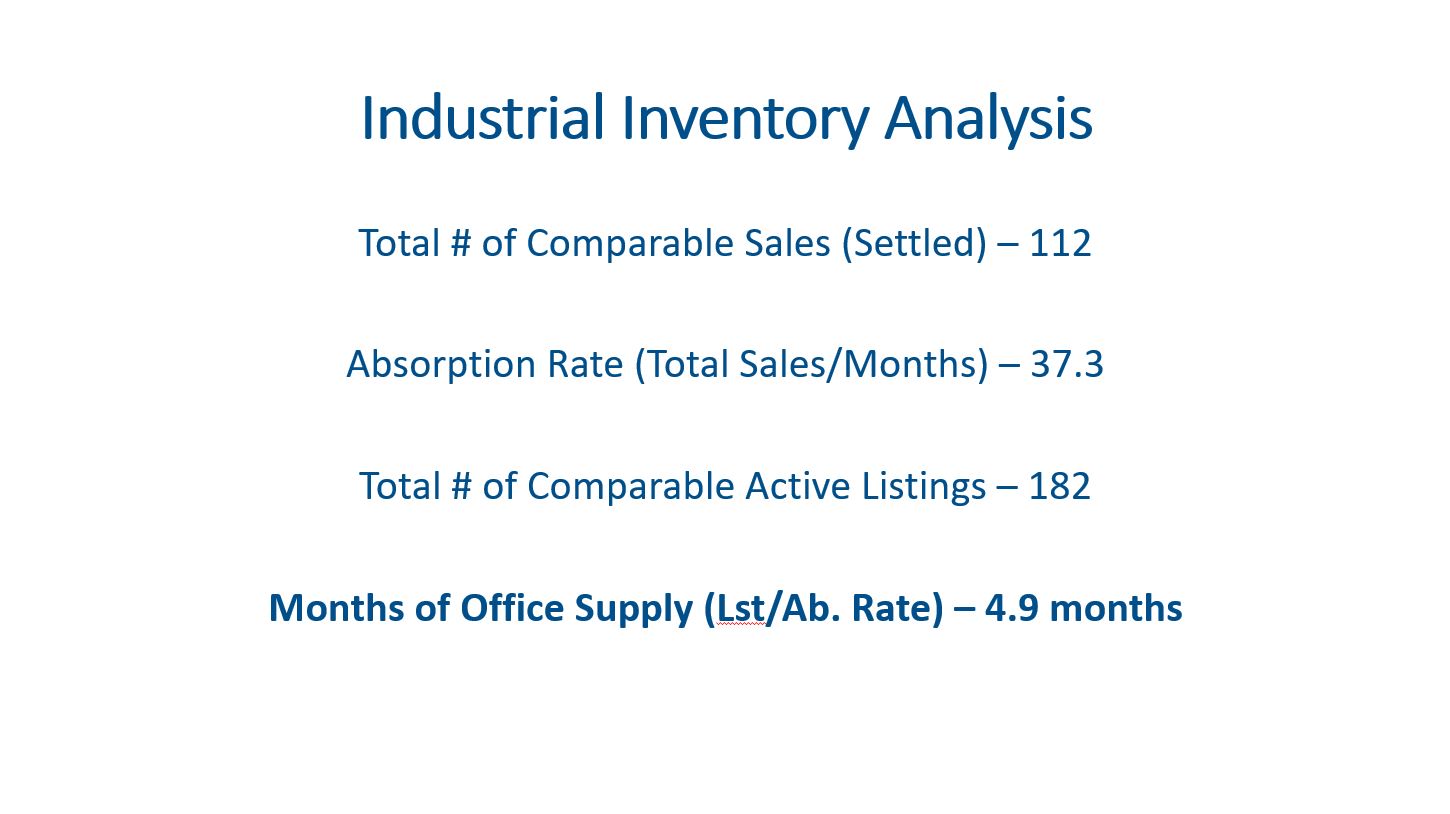
There are 182 active listings for industrial properties. These properties range from a $150k, 594 sf, industrial condo to a massive $69M 630,812 sf distribution center. The dollar volume for listings in Q1 was $453M for the Denver Metro market.
Demand
Demand for industrial properties was fairly strong with 112 sales in Q1 2021. This averages out to a market absorption rate of 37.3 sales per month. The transaction dollar volume was $383M for the quarter, which is down (29.6%) compared to the same time last year. The number of transactions was almost the same as Q1 2020 so the decline is attributed to the size of the properties sold.
When we compare this supply against the absorption rate, the inventory is at 4.9 months. Capitalization rates have been hovering in the mid 6% range since 2017.
New Construction
Developers started construction on 1,049,467 SF in Q1. Although this sounds like a lot it is about (26.5%) less than Q1 2020.
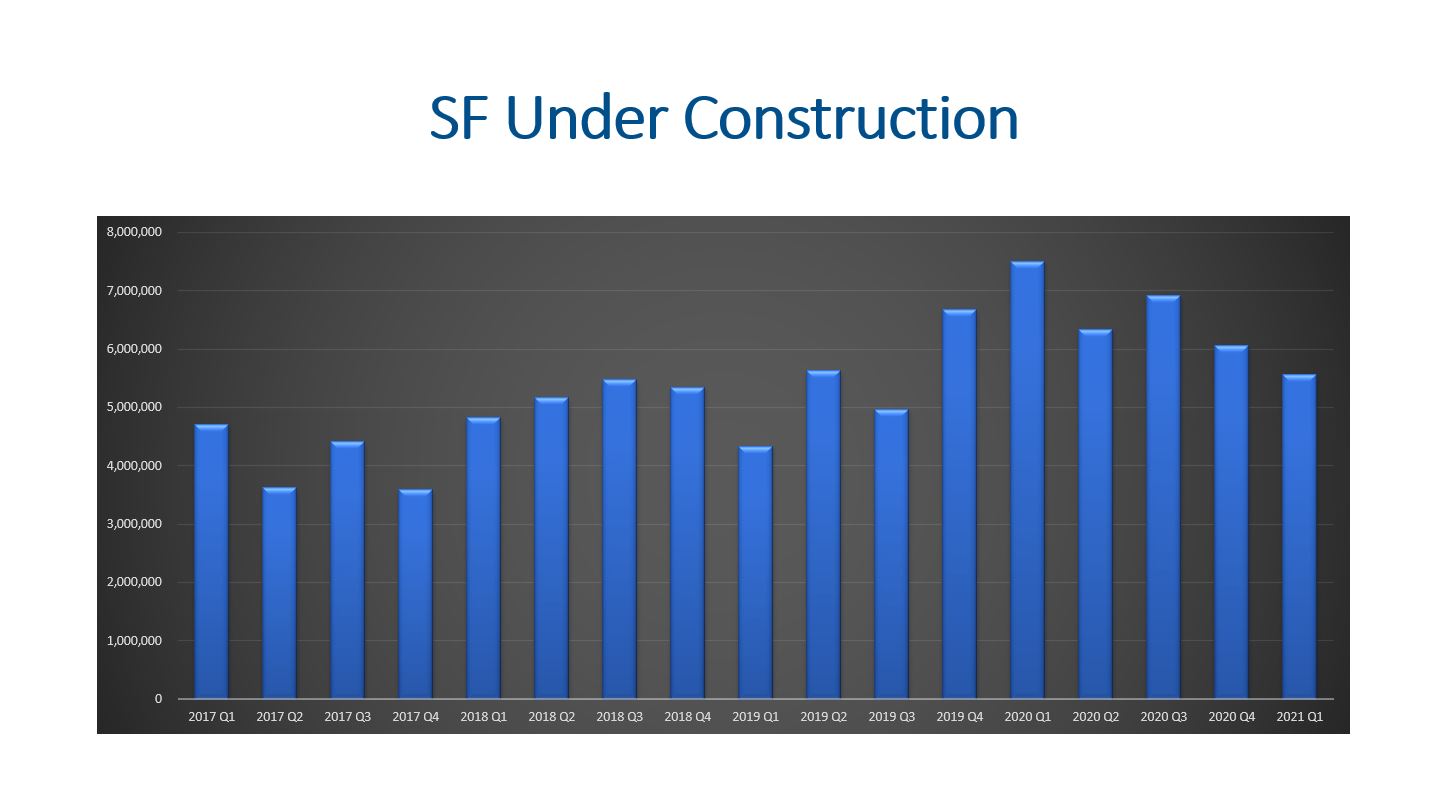
There is currently 5.6M sf under construction compared to the 7.5M sf in Q1 2020. Last year the industrial market had more SF of new construction on average than the 2017, 2018,, and 2019 so developers were working harder to expand this product type.
The industrial market in Denver is around 255M sf so the market is set to expand by approximately 2.2%. The net deliveries in the quarter totaled 1.3M sf.
Vacancy Rates
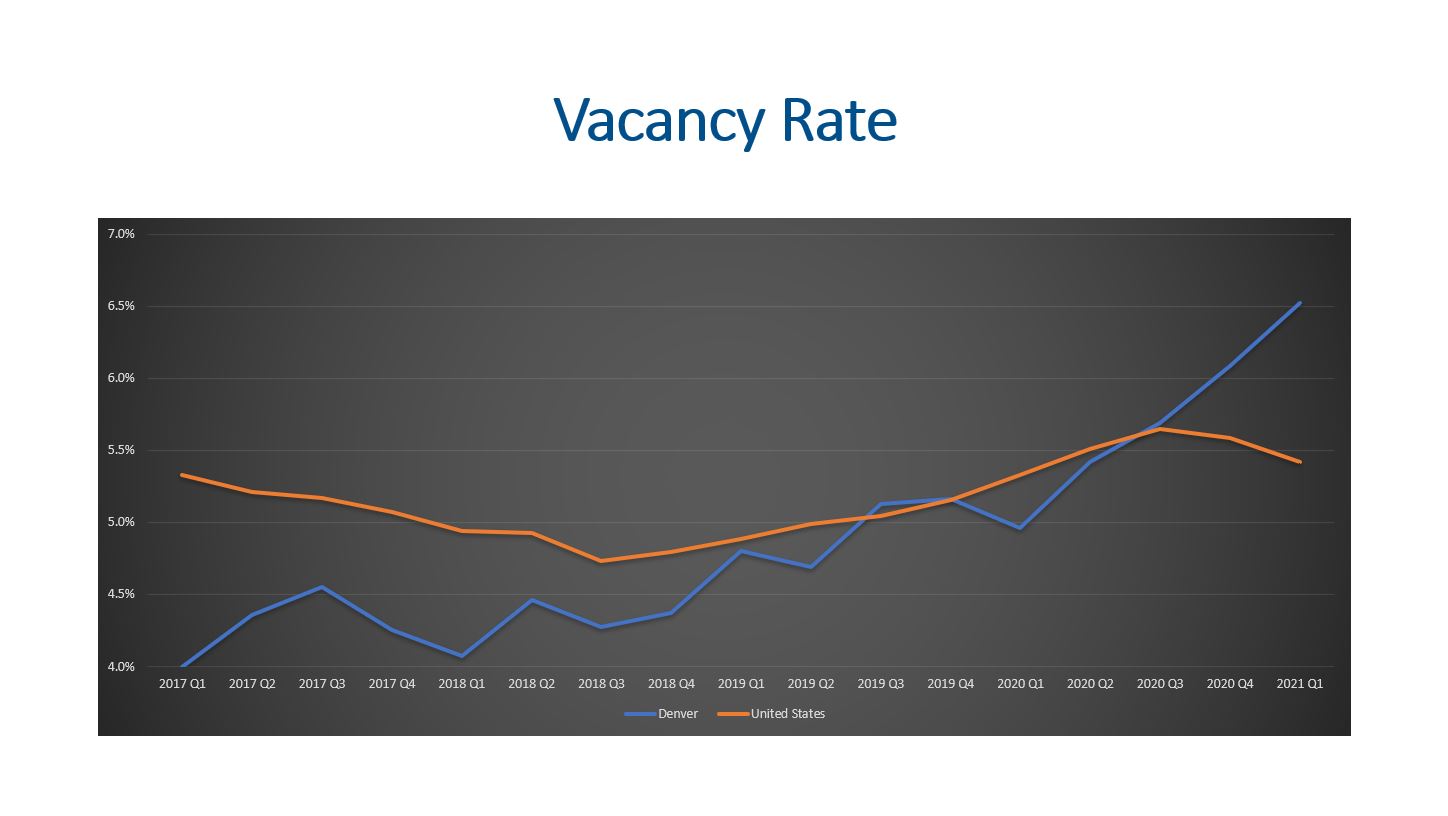
Vacancy rates can be broken down into specialized, logistics, and flex space. If we look at the Denver market on the whole, we are now at 6.5% vacancy with 9.4% availability (vacant and occupied). Denver had divergence in Q2 2020 where it started trending higher than the national average. Now Denver’s vacancy is 1.1% higher than the national average.
Leasing
The average NNN lease is $10.17 per SF per year for industrial space. This represents a 2.1% increase YOY. Flex space is being leased around $14.14 which is 3.5% higher than Q1 2020.
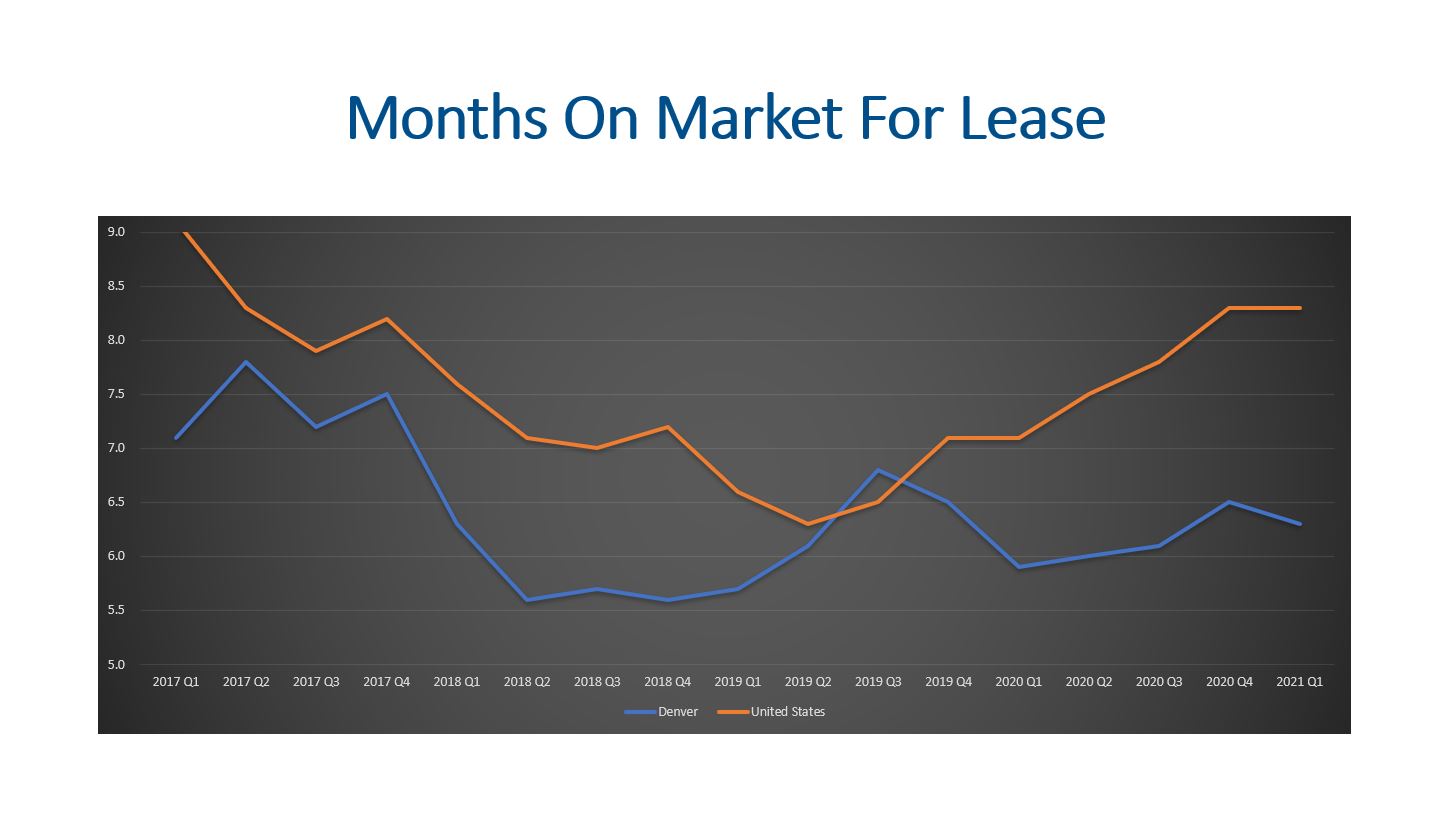
The average months on market for industrial space started to diverge from the national average Q4 2019. Right now industrial space in Denver is taking 6.3 months on average to fill; whereas, the national average is 8.3 months. It is interesting that Denver’s vacancy rate is higher than the national average, but we fill vacancies faster.
Q1 2021 had at net absorption of 69,010 sf. This isn’t much when the average Q1 net absorption for the last two years was over 1M sf.
Final Thoughts
Supply and demand for industrial properties seem to be fairly balanced. Although construction starts and sf under construction have declined, a growth rate of 2.2% seems reasonable with vacancies ticking up. Rental rates have increased over the last year, but our marketing time has been lower than the national average. It will be interesting to continue to monitor the industrial market segment.
Here is a link to the full presentation:
