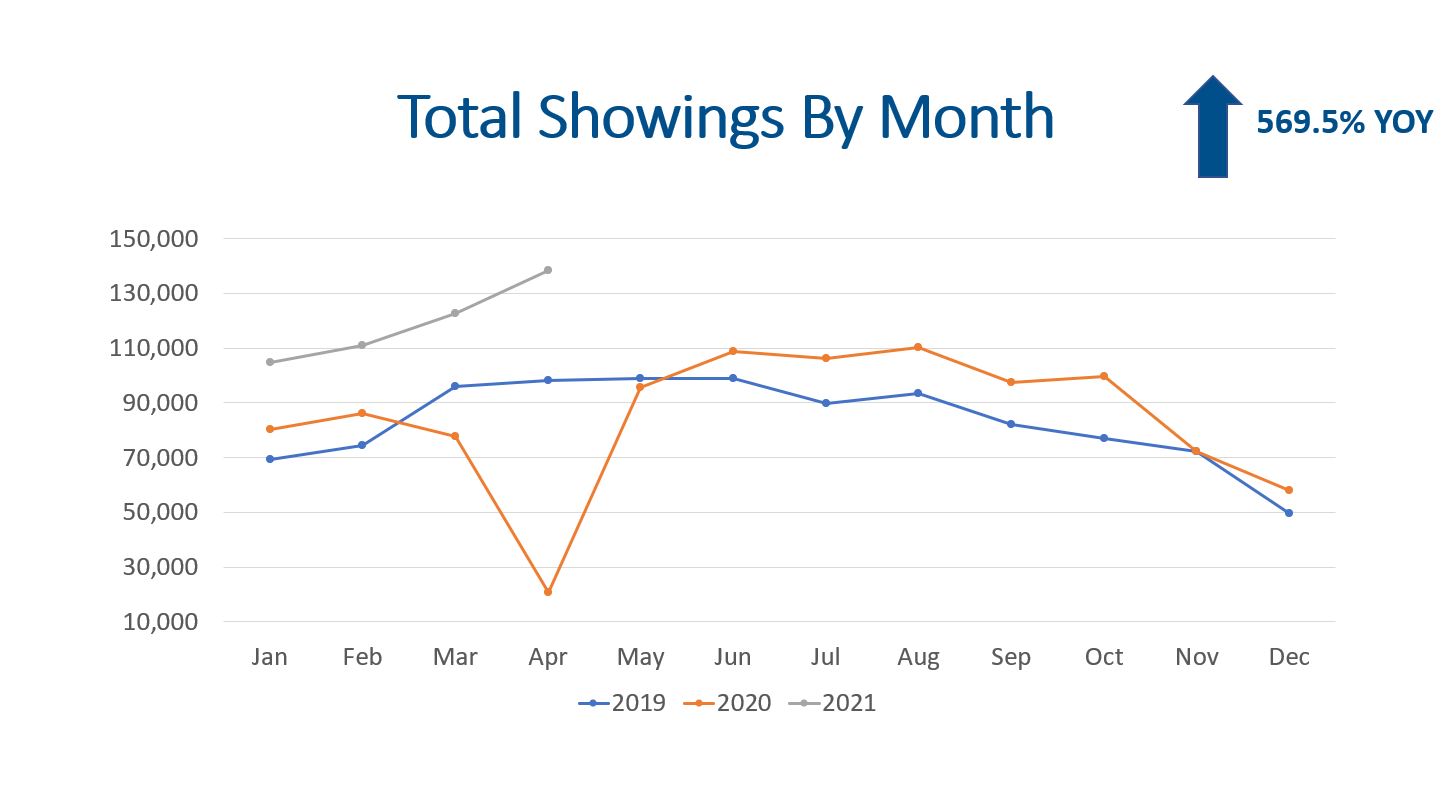
“There are three types of lies: lies, darn lies, and statistics.” ― Benjamin Disraeli. Showings are up 569.5% compared to the same time last year!!! This is true but as my statistics professor use to say, “We can make the number say just about anything we want them to say.”
All kidding aside, it is important to consider the context of the data, quality of the data, and to appropriately interpret the data. We all know what was happening last year as lock downs commenced, so the YOY increase in showings isn’t really that important. With that said, showings are up 40.9% when compared to April of 2019, which is still a large number!
Let’s jump into looking at Supply, Demand, Average Sales Price, and Months of Inventory for April 2021.
Supply
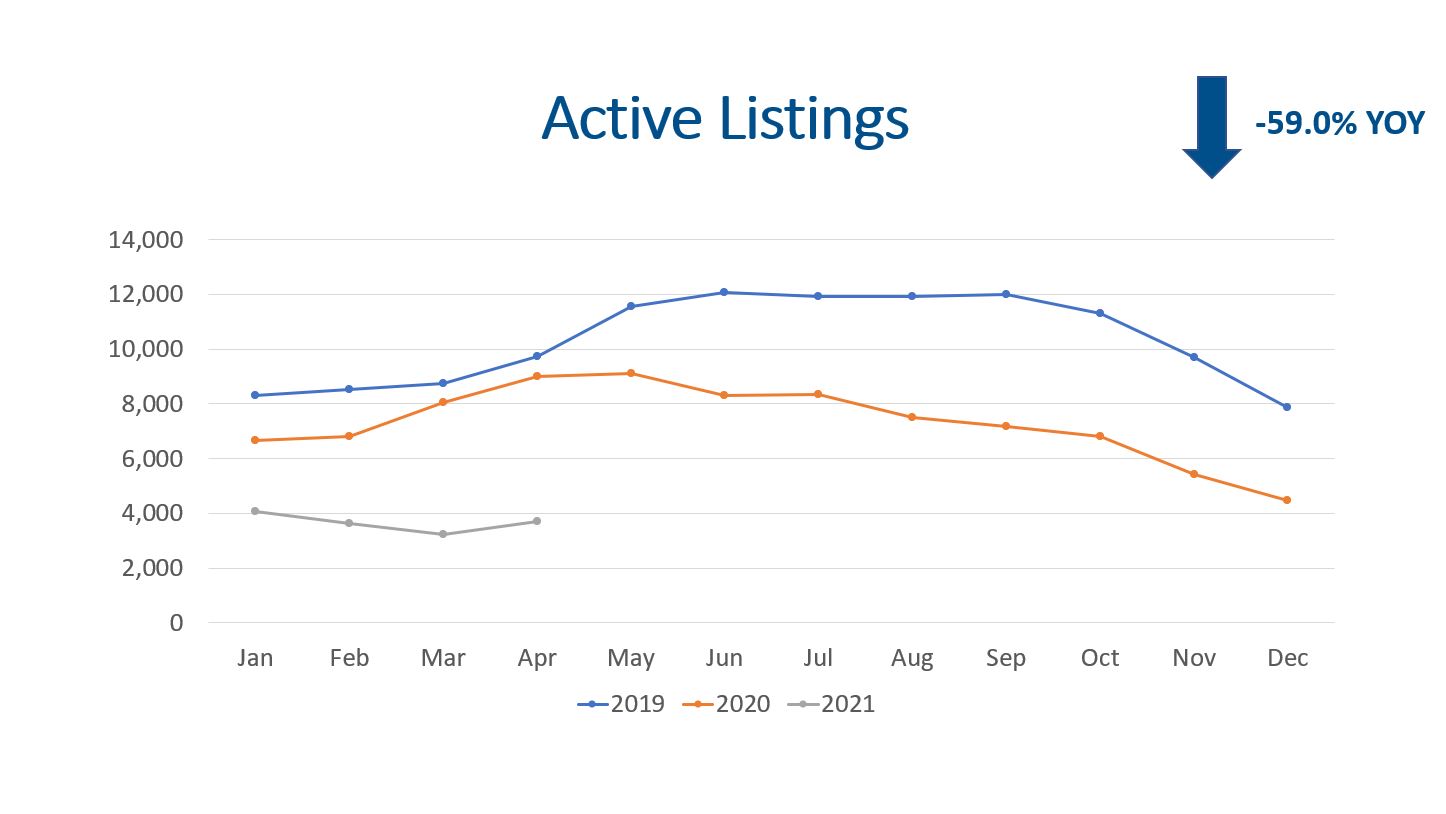
The supply of homes did increase 13.7% compared to March as the Spring selling season commenced and sellers listed their houses for sale; however, we need a larger increase because we still only had 3,692 homes listed for sale. When comparing the active listings to the same time last year, we are down (-59.0%). We expect to see more homes come on the market in May and June.
Demand
Showings are the best leading indicator of demand, and people are out seeing houses in record numbers. It is funny to look at a 569.5% increase in showings, but there really is a new record for showing activity. There were 138,530 showings scheduled for the Denver Metro area through ShowingTime which is the largest showing service in this market.
There were 5,785 buyer contracts accepted by sellers in April. This represents a 97.1% increase YOY. Again, this number is true but not a great benchmark. We are up 5.6% compared to March, and we are up 133 contracts compared to April of 2019.
Closings happen because there was a showing that produced a contract. There were 5,308 closings in April which represents a 42.8% increase YOY and a 3.5% increase from March.
Average Sales Price
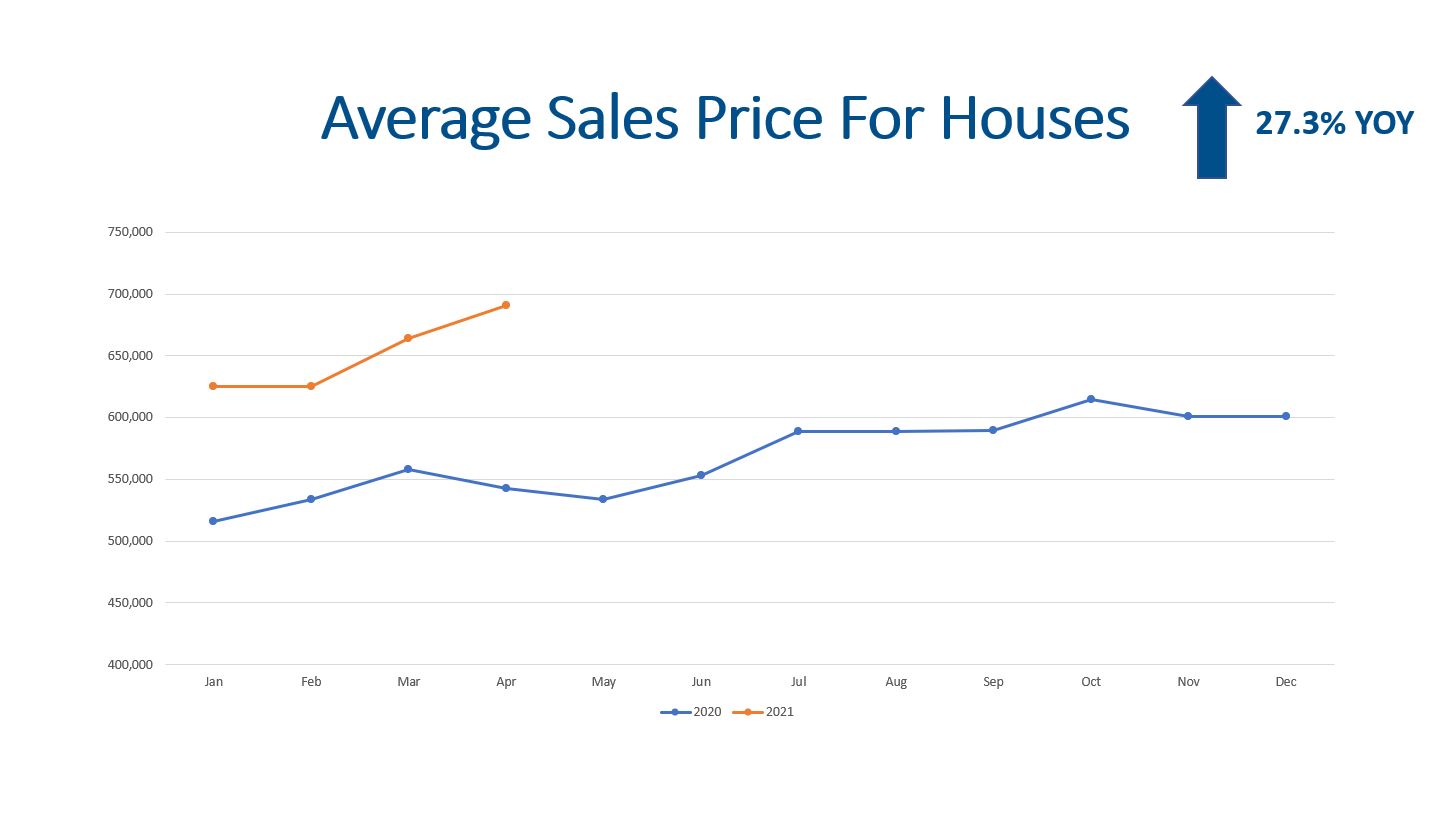
Record low inventory, strong buyer demand, and low mortgage interest rates are still putting upward pressure on prices.
Single family detached homes sold with an average sales price of $690,453 as buyers bid up properties. This represents a 27.3% increase over last year. Condos and town homes came in at $390,188, which is still a large increase of 20.7% YOY. When analyzing detached homes and condos and town homes, single family properties increased 24.3% on average compared to April 2020.
Months of Inventory
Months of inventory is a great indicator to determine where we are at in the market cycle. A seller’s market has 0-3 months of inventory. A balanced market is 4-6 months of inventory, and 7+ months of inventory is a buyer’s market.
Recolorado’s data shows we had 1 month of inventory. If we do the math, there were 3,692 listings and 5,308 closings, we have 2.57 weeks of inventory. This means if no new homes come on the market, we will have zero homes for sale within 2.57 weeks.
Final Thoughts
All in all, supply, demand, prices, and months of inventory are all great indicators of market health. Record highs for showing activity and contracts show strong demand. Record low inventory is worth noting as a fewer number of sellers are listing their properties. In the conversations we have been having, there are a lot of people who want to list, but they are concerned about finding a replacement property. We believe more appreciation for homeowners in 2021.
Here is a link to the full presentation:


