Wow!!! Watching and participating in this market is something else… Again, the Denver Metro residential real estate market saw record high showings and record low inventory! Towards the end of March, we started seeing some more homes hit the market but not enough. Let’s jump into Supply, Demand, Average Sales Price, and Months of Inventory for this review.
Supply
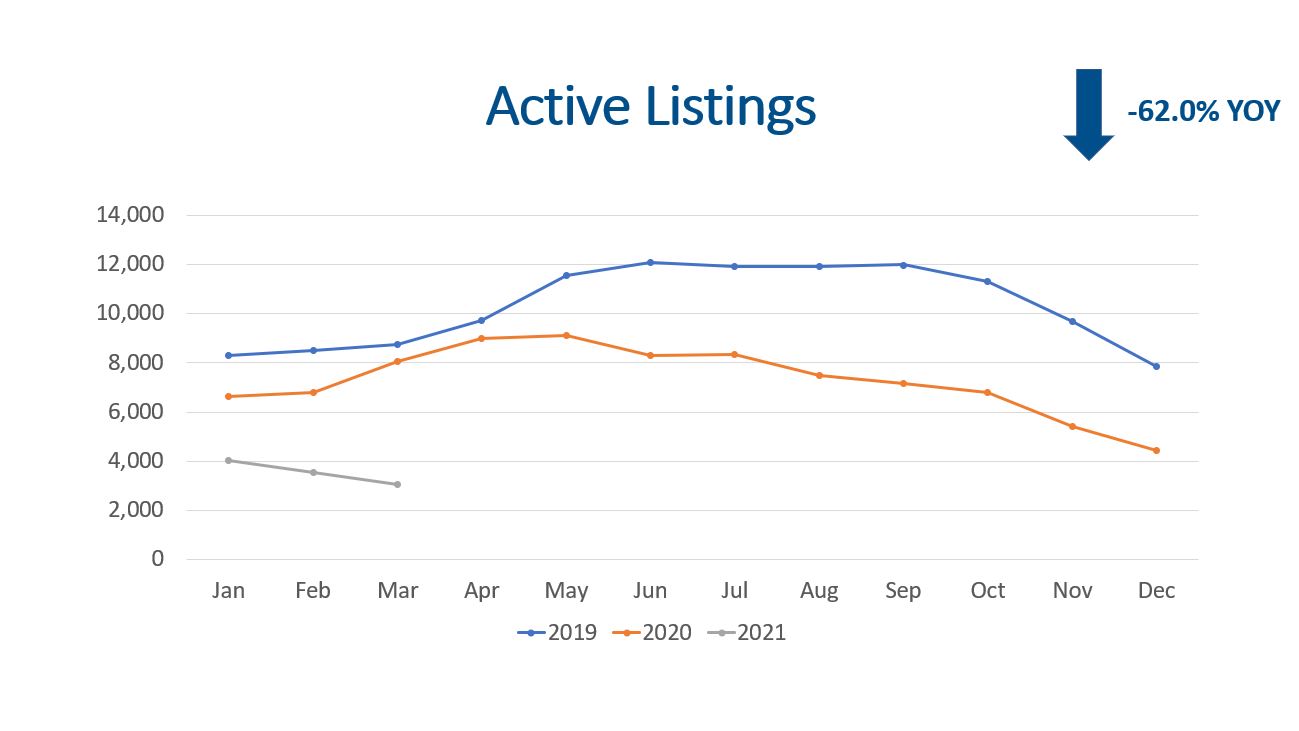
Typically, supply increases from January to March as we come out of the coldest months and Spring starts. Instead of overall supply increasing from January to March, supply has actually been decreasing!
March 2021 saw just 3,051 homes get listed. This represents a (62%) decrease compared to the same time last year. Ouch!!!
Demand
Who wants to buy? Lots of people!!!
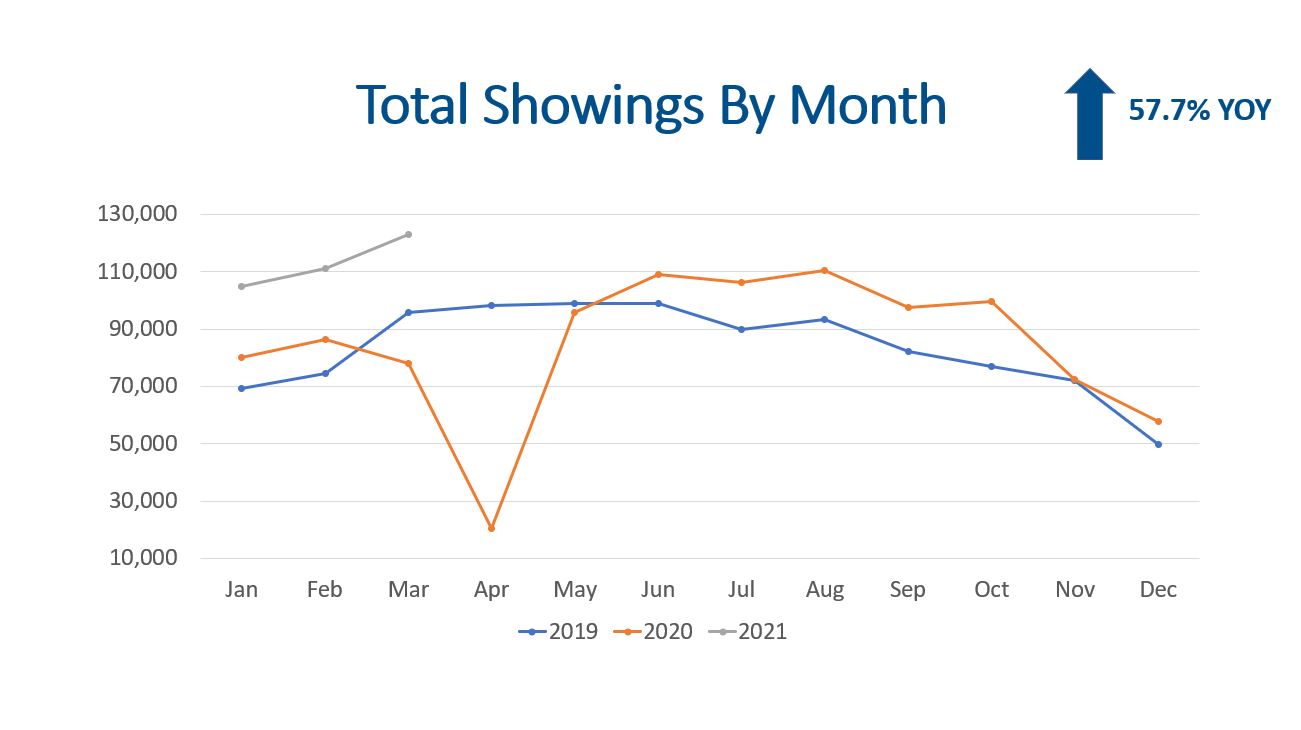
Showings are the leading indicator of demand. If we just look at the face value of the data there was a 57.7% increase compared to this time last year, but what happened in March of last year?!?!
The kids of our city went on Spring break and that week off turned into the rest of the month as the headlines rolled in about Covid-19 and schools closed. Even if we adjust last year’s showings up to where it should have been, there was a 22%+ increase YOY.
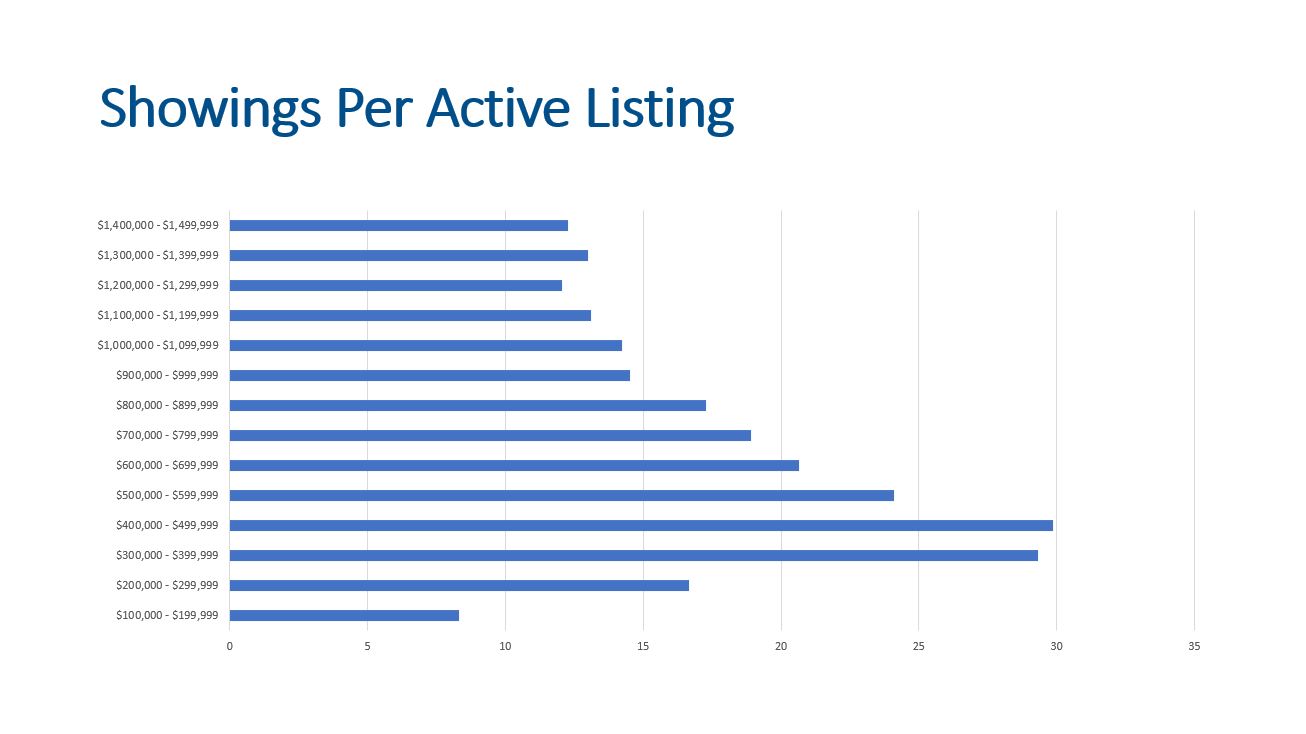
Another interesting metric is showings per active listing broken out by price range. This shows us which areas of the market have the most activity.
There were 5,587 sellers that accepted buyer offers in March. This represents a 31.6% increase YOY. Again, some of the increase is contributed to the reaction to Covid.
It is worth noting that residential real estate contracts typically close in 30 to 35 days, so we can expect most of these to close in April.
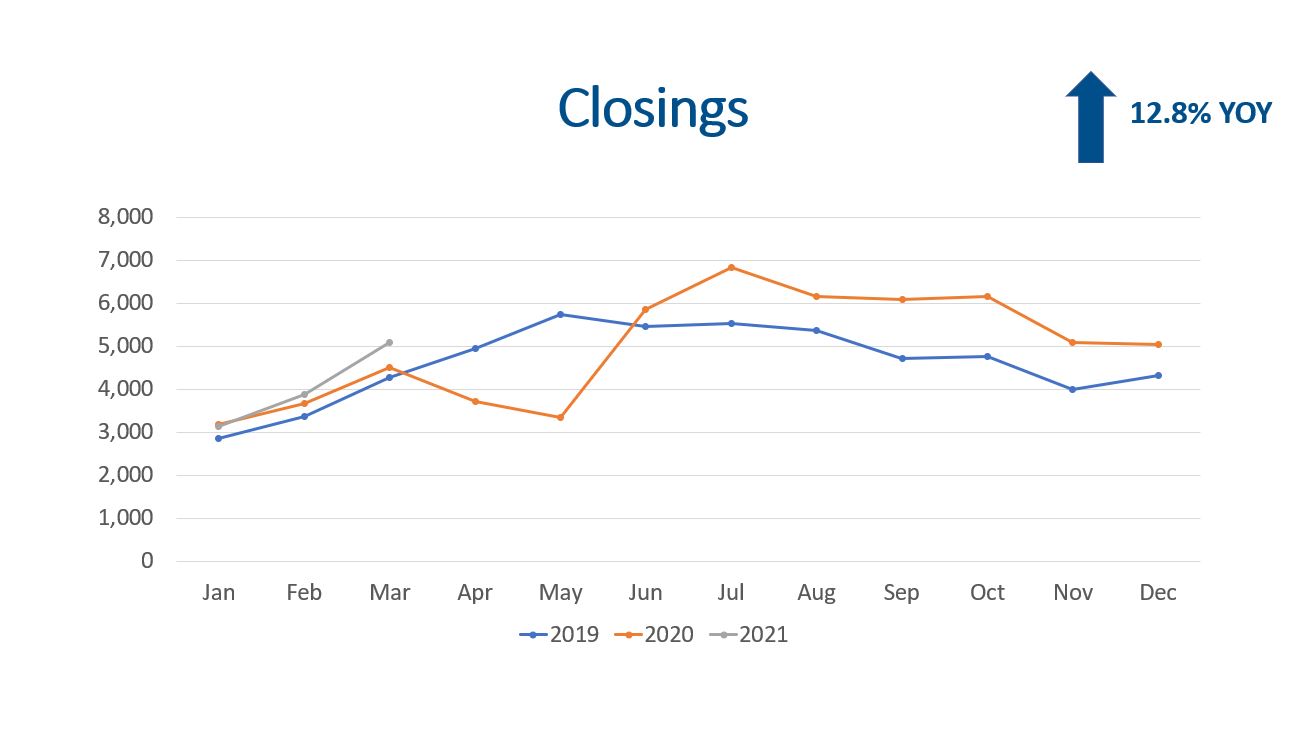
Closings are the result of showings and contracts, and we saw a nice up tick there as well. There were 5,094 closings in March which represents a 12.8% increase YOY.
Average Sales Price
Mortgage rates have climbed but most 30-year mortgages are in the 3% to 3.5% range. The low mortgage rates allow buyers to afford more than if we had higher interest rates.
Record low inventory, strong buyer demand, and low interest rates are still putting upward pressure on prices.
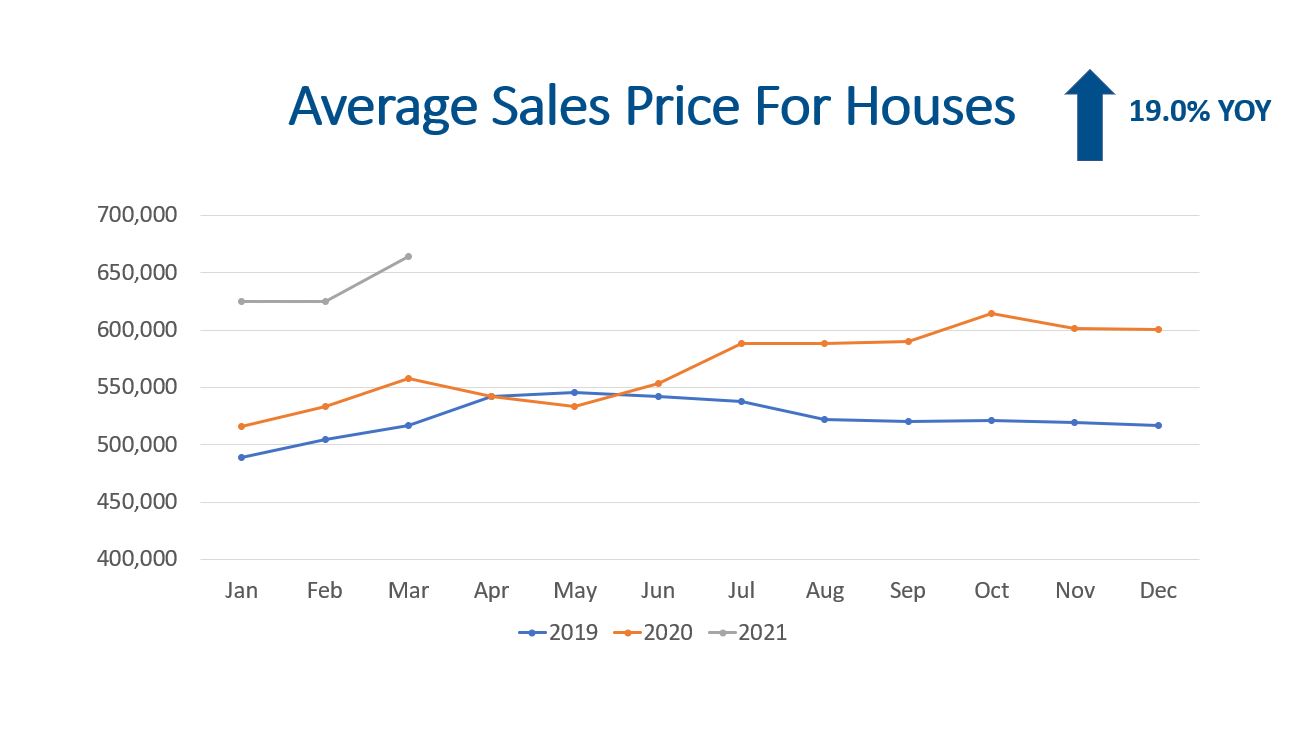
Single family homes had an average sales price of $663,860 as buyers bid up properties. This represents a 19.0% increase over last year. Condos and town homes came in at $378,339, which is a more modest 9.7% increase YOY. All together the Denver Metro residential real estate market increased 15.3% YOY.
Months of Inventory
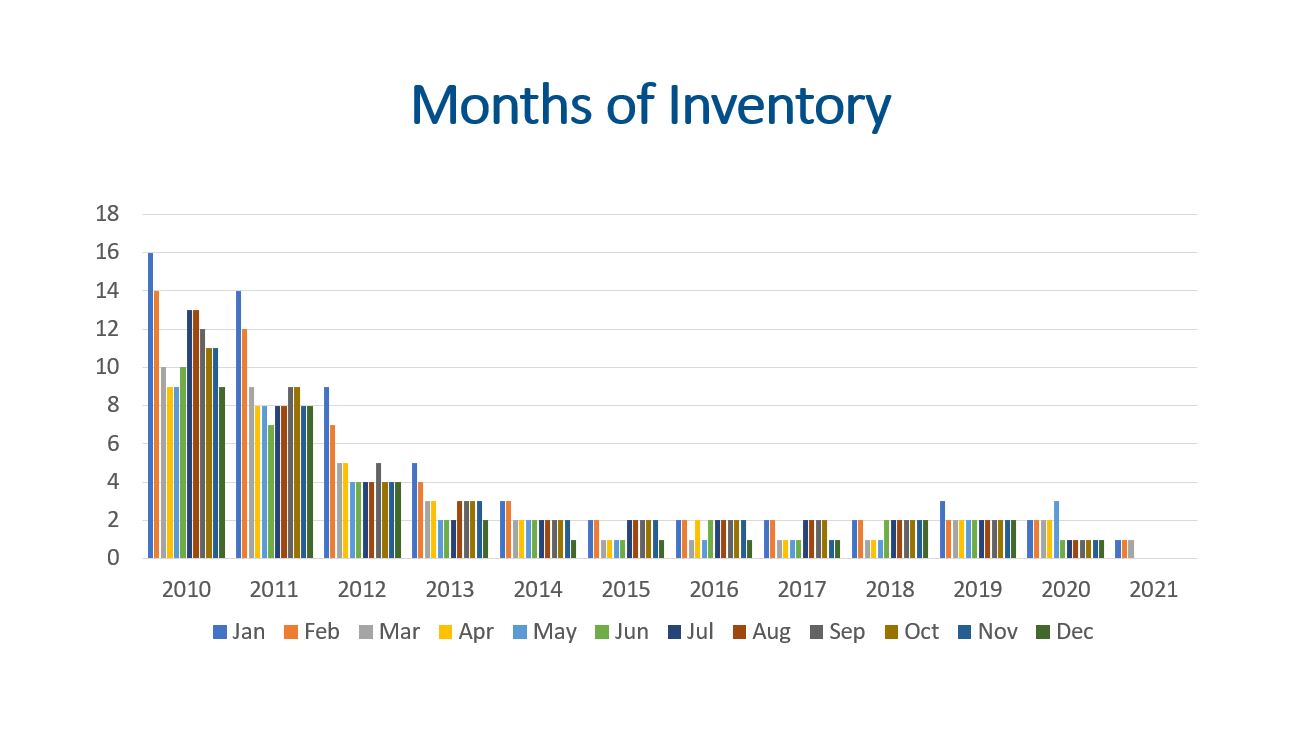
Months of inventory is a great indicator to determine where we are at in the market cycle. A seller’s market has 0-3 months of inventory. A balanced market is 4-6 months of inventory, and 7+ months of inventory is a buyer’s market. A seller’s market will see prices going up. A balanced market is more modest growth to no growth, and a buyer’s market will see prices decline.
March 2021 saw another month with 1 month of inventory according to Recolorado’s data. If we do the math the inventory actually dips below 1 month. With 3,059 active listings and 5,094 closings, we have 2.6 weeks of inventory. Yikes!
Final Thoughts
All in all, supply, demand, prices, and months of inventory are all great indicators of market health and determining where we are in the market cycle. New record highs for showing activity and contracts equal strong demand. Record low inventory indicates sellers are still reluctant to list. Historically, more and more properties should be listed in the coming months, but we will have more and more buyers entering the market as well.
Time will tell where all of this is headed, I certainly don’t have a crystal ball. With that said, I think the writing on the wall suggests we will continue to see low inventory and prices going up in the near term!
Here is a link to the full presentation:
