I really thought the pandemic was going to move us into a balanced market! The first couple months were quite interesting to watch. Then it became apparent we were headed deeper into a seller’s market. Let’s jump into looking at Supply, Demand, Average Sales Price, and Months of Inventory for May 2021.
Supply
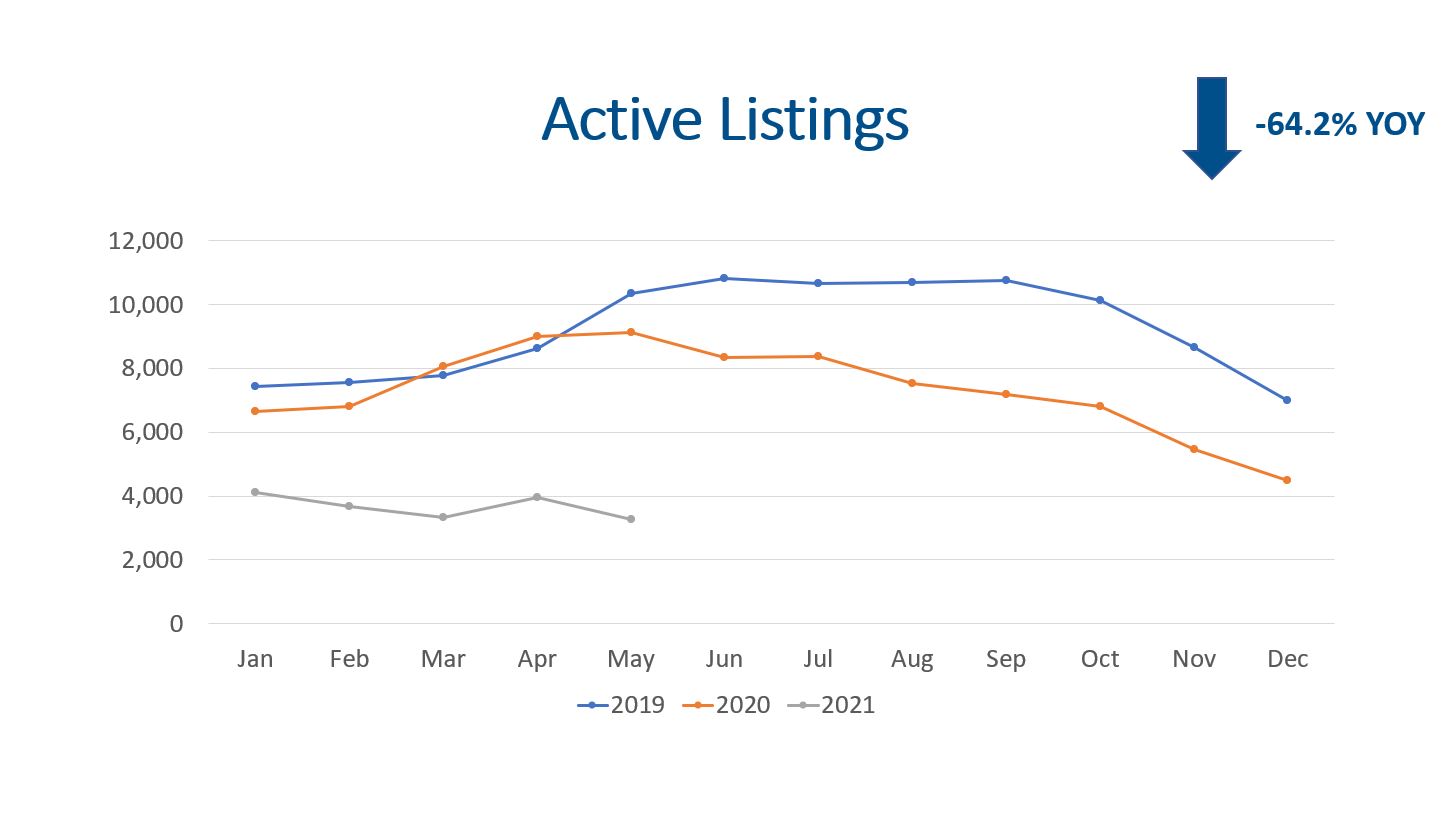
We ended May with just 3,264 homes on the market. The supply of homes decreased (17.5%) compared to April 2021. Furthermore, the total listings were down (64.2%) compared to May of 2020. If we compare the active listings to May of 2019, we were down (77.7%)!
We expected to see more homes come on the market in May, not less. Hopefully, June, July, and August will see more properties coming to the market. The total number of new listings during the month were 6,468.
Demand
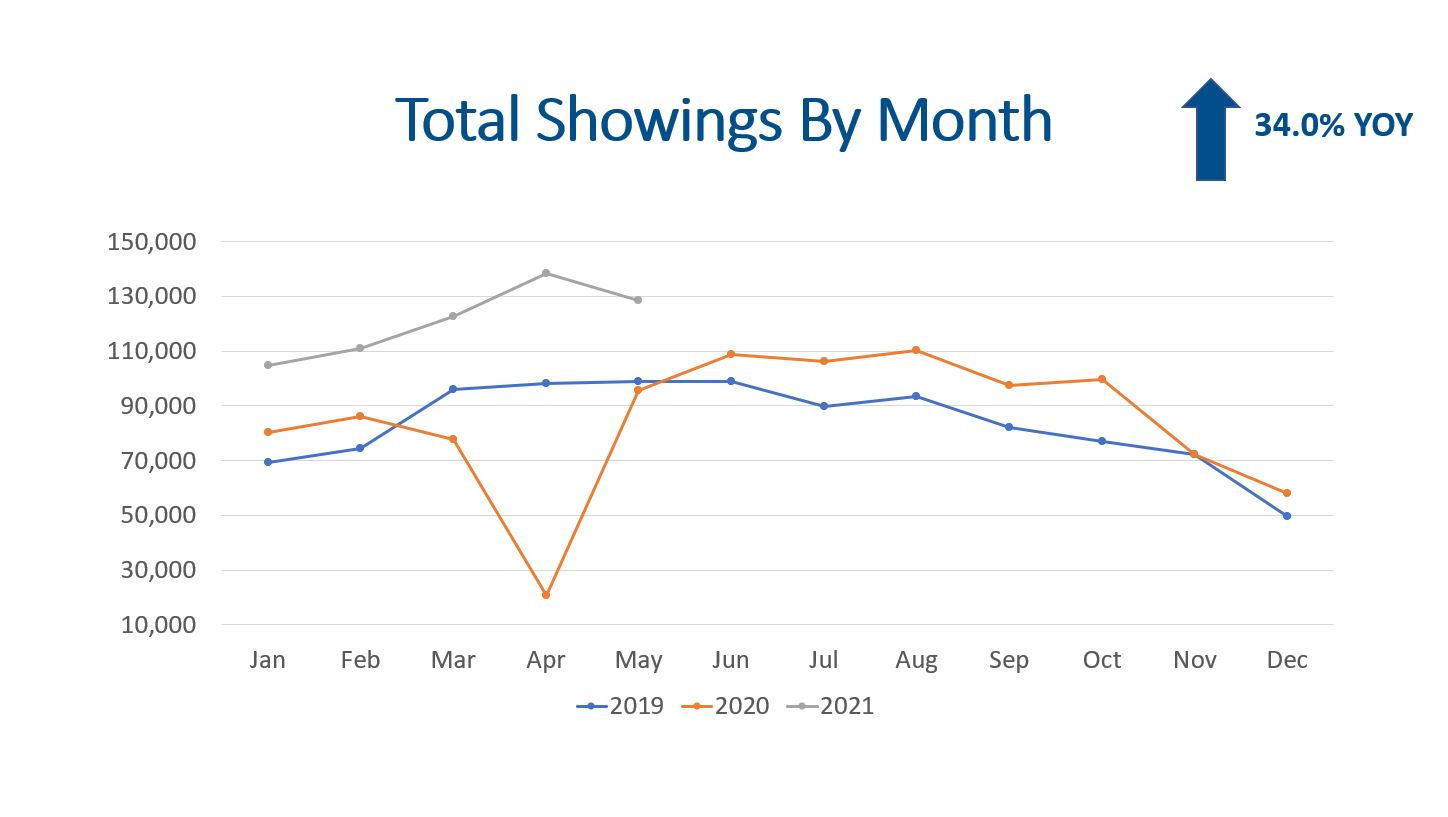
Showings are the beginning of the process of purchasing residential real estate. Therefore, showings are a great leading indicator of demand. Total showings through ShowingTime, the largest showing service in our market, were 128,386 which is a very healthy number. Although this is 10,144 fewer showings than April it is still about 30,000 more showings than May 2020 or May 2019.
There were 6,463 buyer contracts accepted by sellers in May. This represents a 6.3% increase YOY and a 15.1% increase over April.
Closings happen because a showing turned into a contract. There were 5,455 closings in May which represents a 62.3% increase YOY and a 1.6% increase from April. When comparing the total closings to May 2019, we were actually down (5.1%).
Average Sales Price
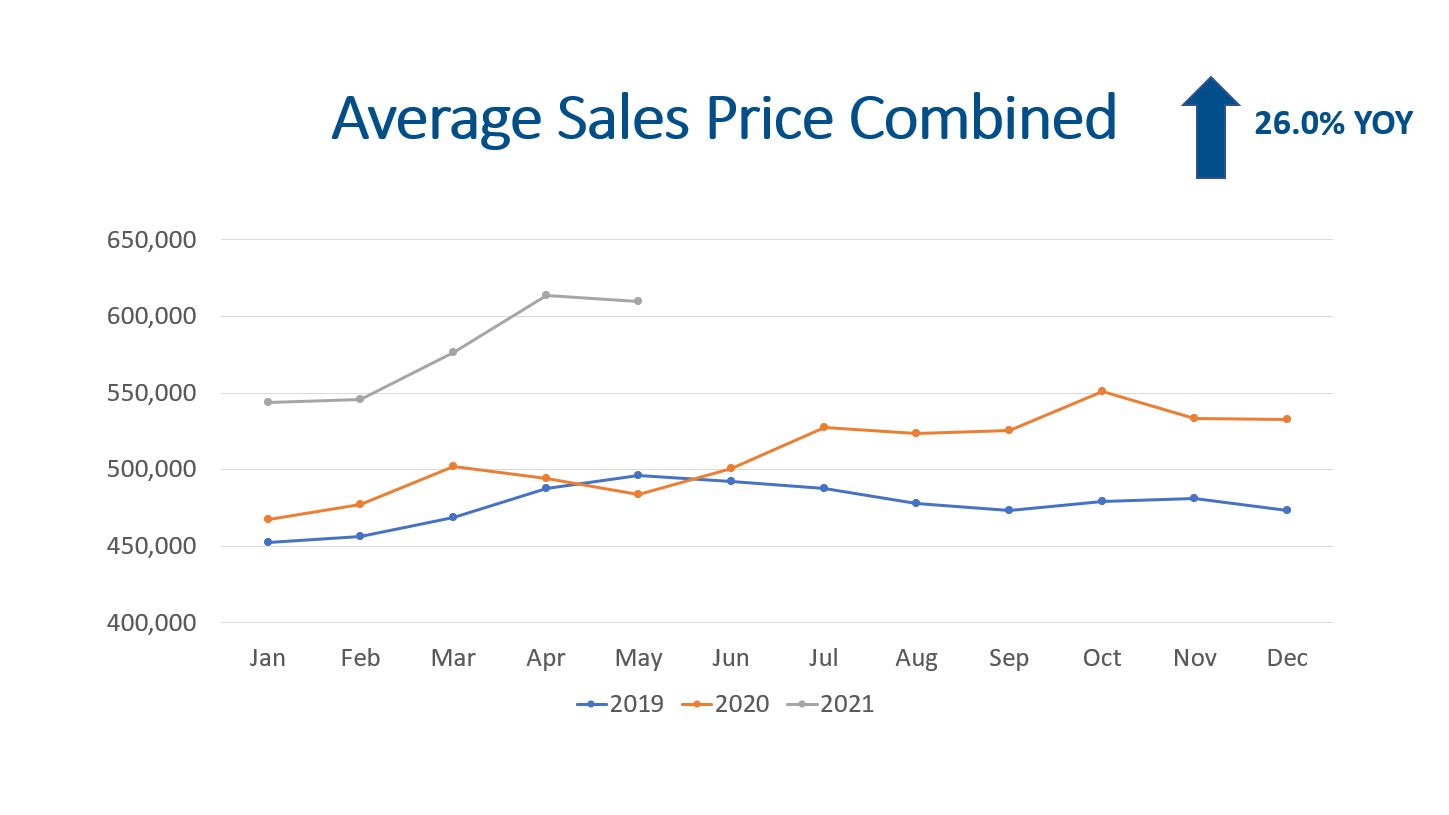
Again, record low inventory, strong buyer demand, and low mortgage interest rates are still generating higher purchase prices.
Single family detached homes sold with an average sales price of $692,426. How many times have Coloradans heard, “We are becoming California!” As a point of reference San Diego has a median home price of $754,557 and Los Angeles is at $794,575. Therefore, Denver is still more affordable but not by much… When translating the difference in the principal and interest payment an extra $62k financed is $272 per month and an extra $100k financed is $438 per month.
The average sales price for single family homes rose 29.8% over last year, and the average condo and town home rose 25.5% YOY. Combined single family homes, condos, and town homes rose 26.0% on average compared to May 2020.
Months of Inventory
Months of inventory is a great indicator to determine where we are at in the market cycle. A seller’s market has 0-3 months of inventory. A balanced market is 4-6 months of inventory, and 7+ months of inventory is a buyer’s market (this is where prices decline).
Recolorado’s data shows we had 1 month of inventory. If we do the math, there were 3,264 listings and 5,455 closings, we have 2.5 weeks of inventory. This means if no new homes come on the market, we will have zero homes for sale within 2.5 weeks!
Final Thoughts
All in all, supply, demand, prices, and months of inventory are all market indicators. Record highs for showing activity and contracts build the case for strong demand. Record low inventory seems to be driven by fewer sellers listing their properties. Some sellers may still be concerned about covid-19, but I speculate that many are concerned about finding an acceptable replacement property. We believe more appreciation is instore for homeowners in 2021.
Here is a link to the full presentation:


