The Denver Commercial Real Estate Market saw some interesting trends emerge in Q3 2025. The four major property types saw $1.9B in total sales for Q3, which is $700M less than Q3 2024. This represents a substantial decrease in year-over-year (YOY) sales volume. In Q3, multi-family sales were the highest in dollar volume but the lowest in sale transactions. Therefore, a lot of larger, more expensive, properties sold. There is a significant volume of new apartment and townhome projects that have either broken ground or are actively under construction, adding to a supply-heavy market. Demand for multi-family rental units in Denver is down and vacancies have risen to the highest level in the last 22 years.
The four commercial property types we are tracking are: retail, multi-family, office, and industrial. It is interesting to look at the Commercial Real Estate Market as a whole and at these individual property types. Let’s dive into supply, demand, new construction, vacancy rates, and rent growth for Denver Commercial Real Estate.
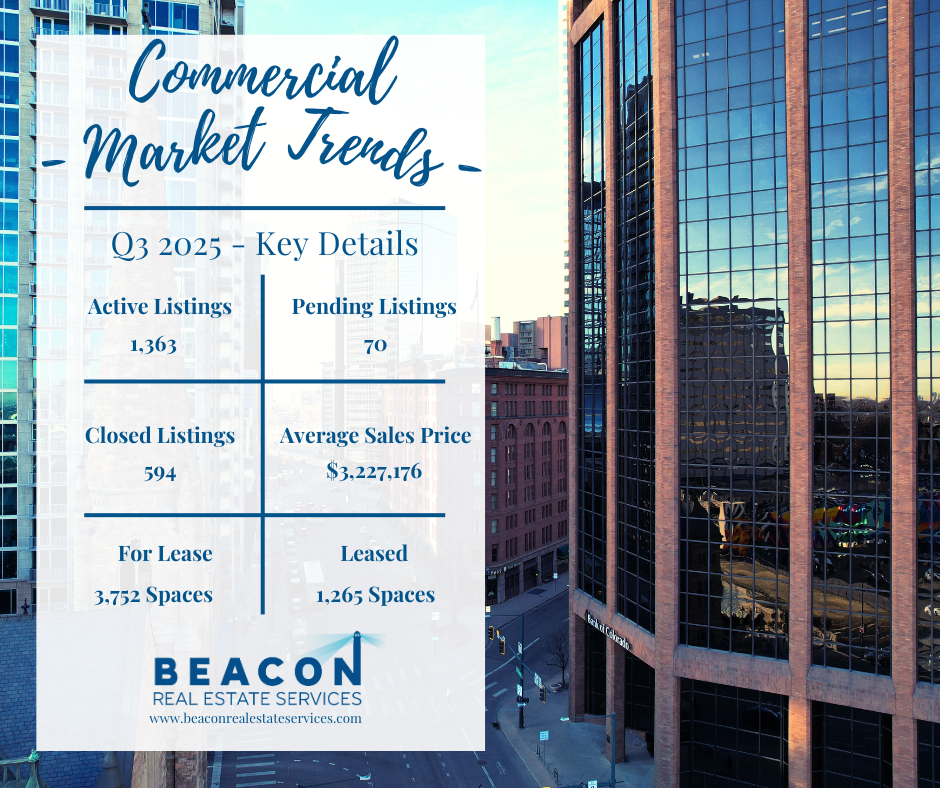
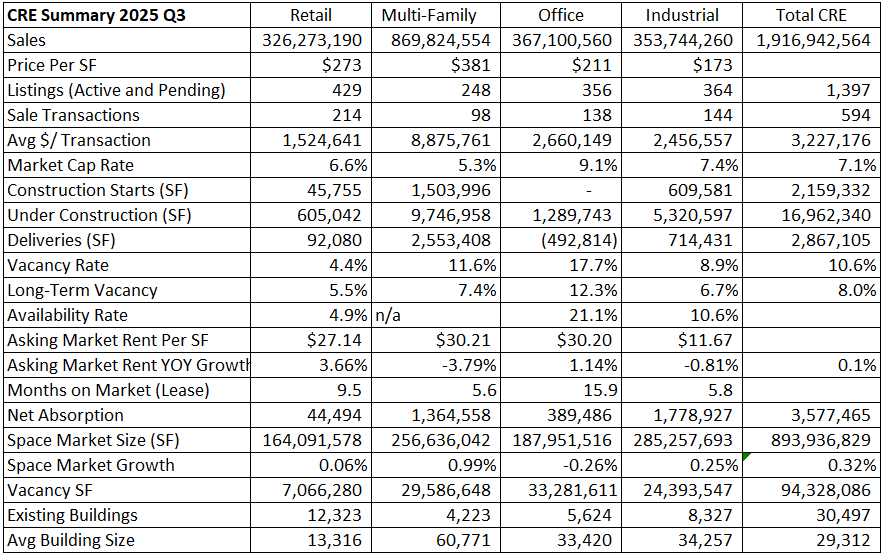
Below is a summary of key details for each property type:
Supply
There are 1,397 active and pending listings across the four major property types. New construction pipelines have contracted significantly from their all-time highs, but there was still almost 17M SF under construction during the quarter. During Q3 2025, developers delivered 2.867M SF to the Denver MSA. As previously mentioned, the growth has been primarily in multi-family with a pipeline of 9.7M SF under construction. The next highest pipeline under construction is industrial with 5.3M SF. It is worth noting that the Denver MSA has 30,497 buildings totaling 893M sf of space. Therefore, the overall CRE market expanded by 0.32% in Q3 2025.
Demand
Demand for commercial real estate is created by population growth and job growth. When our population is growing, there is an increased demand for housing and shopping. When jobs are created, there is more demand for industrial, office, and retail. With that said, office demand has changed a lot since the pandemic, as many employees were, and still are, working from home. Many companies are bringing their employees back into the office, but office vacancies are the highest they have been in 22 years. Kastle Systems is a security company tracking key card swipe data, and they are showing 50-60% of people entering office buildings compared to before the pandemic.
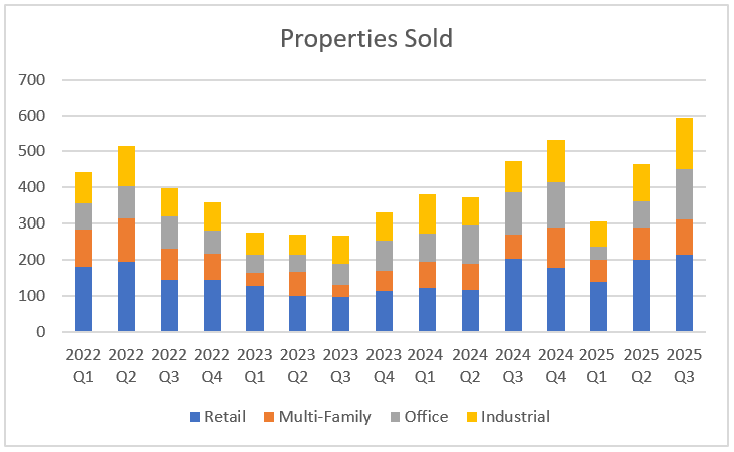
There were 594 closed sales in Q3 2025, which is an increase from 474 closed sales in Q3 2024. Sales has increased but sales volume has decreased. The total dollar volume for retail, multi-family, office, and industrial was $1.9B in Q3 2025 compared to $2.6B in Q3 2024.
Another gauge for demand is net absorption. Absorption is a gauge of the space tenants need to live or operate their businesses. In Q3 2025, Denver tenants absorbed 3,577,465 SF across retail, multi-family, office, and industrial properties. This is vastly different compared to the negative absorption of 2,562,586 SF that Denver tenants gave back in Q2 2025.
New Construction
Developers started construction on 2.16M SF during Q3 2025. This is less than the 2.49M SF of construction that was initiated in Q2 2024. Also, the construction pipeline was only 16.96M SF in Q3 2025 compared to 20.5M SF Q3 2024. The total under construction has been slowing since multi-family peaked at 31,694 units during Q1 2023. Therefore, we are losing construction jobs with fewer construction projects.
During Q3 2025, retail started 45,755 SF, multi-family started 1.5M SF, and industrial started 609,581 SF.
Developers delivered 2.867M SF of commercial space to the market during Q3 2025.
Next, let’s look at vacancy rates to see how much space is not occupied.
Vacancy Rates
A vacancy rate is a metric comparing the amount of unoccupied SF to the total SF of all the buildings in a market. Denver has vacant SF is 94.3M in Q3 2025, but we had 54.1M SF of vacancy in Q3 2024, which is a pretty big difference. It is worth mentioning, Denver has almost 894M SF of commercial buildings, so our commercial vacancy rate is 10.5%. As you can see in the chart below, Office historically has a higher vacancy rate than all the other property types.
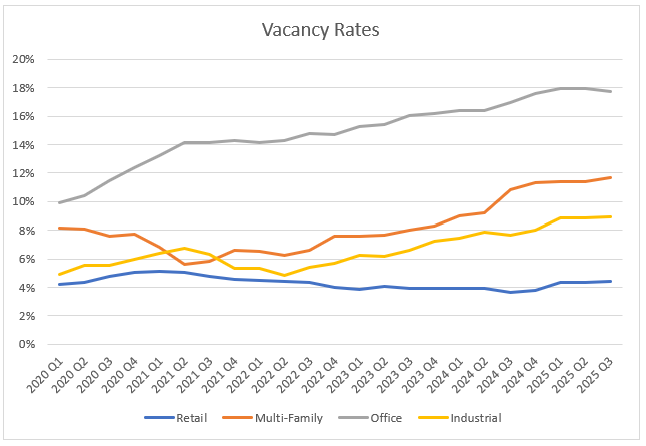
If we are to understand commercial vacancy rates, we need to compare the current vacancy rates compared to the long-term vacancy rates. Multi-family, Office, and Industrial all have higher vacancy rates when compared to the long-term averages, which will limit rent growth. Retail is the only property type to have a vacancy rate below the long-term average. This is because retail has not been delivering much new product to the market.
Let's transition into rent growth.
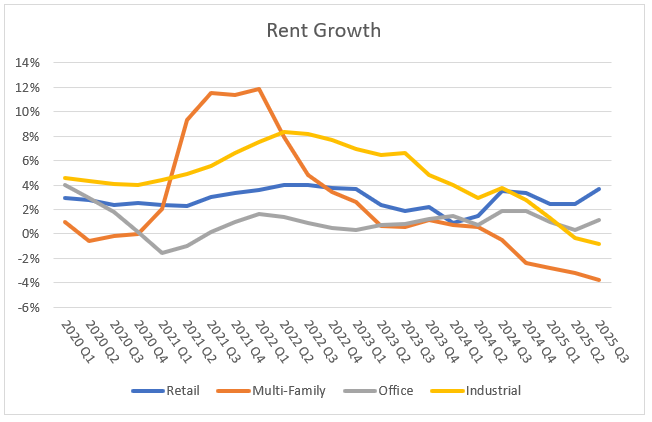
Rent Growth
The higher vacancies has translated into lower rent growth. Rent growth could be lumped into demand but it is interesting enough to separate into a new paragraph. Retail properties posted the highest rent growth at 3.66%. Office had the next highest rent growth at 1.14%. Multi-family rents came down by (3.79%), and industrial rents compressed by (0.81%). Multi-family is contracting because of all the new construction. In addition, to rent compression, many buildings are offering 10-13 weeks of free rent with a one year lease.
Final Thoughts
In summary, supply, demand, new construction, vacancy rates, and rent growth are all good key performance indicators for the commercial real estate market in Denver. We have a decent supply of properties for sale. Demand for properties, as measured by sales volume, has increased slightly during Q3, when compared to Q2 2025, but the higher interest rates continue to put pressures on cap rates to rise. Though the transaction volume of smaller properties has picked up, developers stay hard at work building multi-family and industrial properties. Vacancy rates are different among the different commercial property types. We expect office vacancies to stay higher for the foreseeable future. We also expect vacancy rates to climb with more multi-family units being delivered. Lastly, rent growth is stalling or negative. Retail is the only property type with rent growth outpacing inflation.
Link to all of the presentations for each property type: