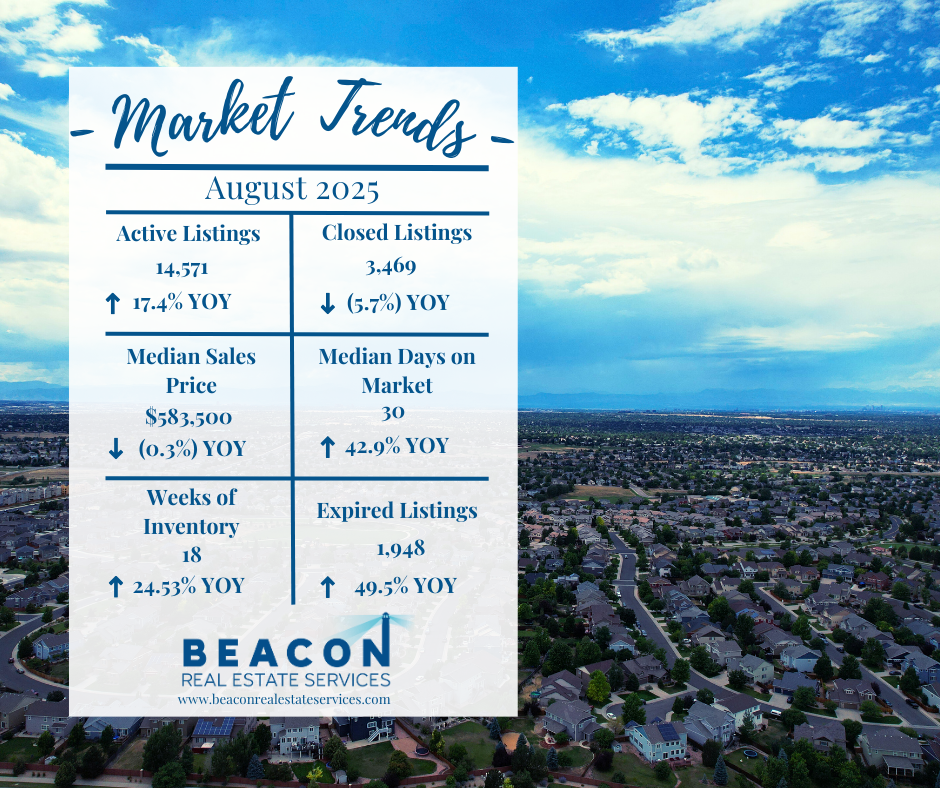
The Denver residential market is in a much different place than it was a few years ago. The 10-year average for new listings in August is 6,204 but we saw 5,101 new listings during this August. Although this is lower than the average, the total number of listings has climbed to 14,571. Furthermore, we saw 1,948 sellers give up on selling and let their listing agreement expire. This is 49.5% more than August 2024 and more than double the long-term average. Meanwhile, the 10-year average for closings in August is 5,065, and we had only 3,469 closings. This shows that buyer demand remains softer than average. The average 30-year mortgage rate, according to Freddie Mac, is 6.35%, which continues to subdue demand. Let's dive into the key market data for the Denver residential real estate market to understand what is happening with supply, demand, sales prices, and months of inventory for August 2025.
Supply
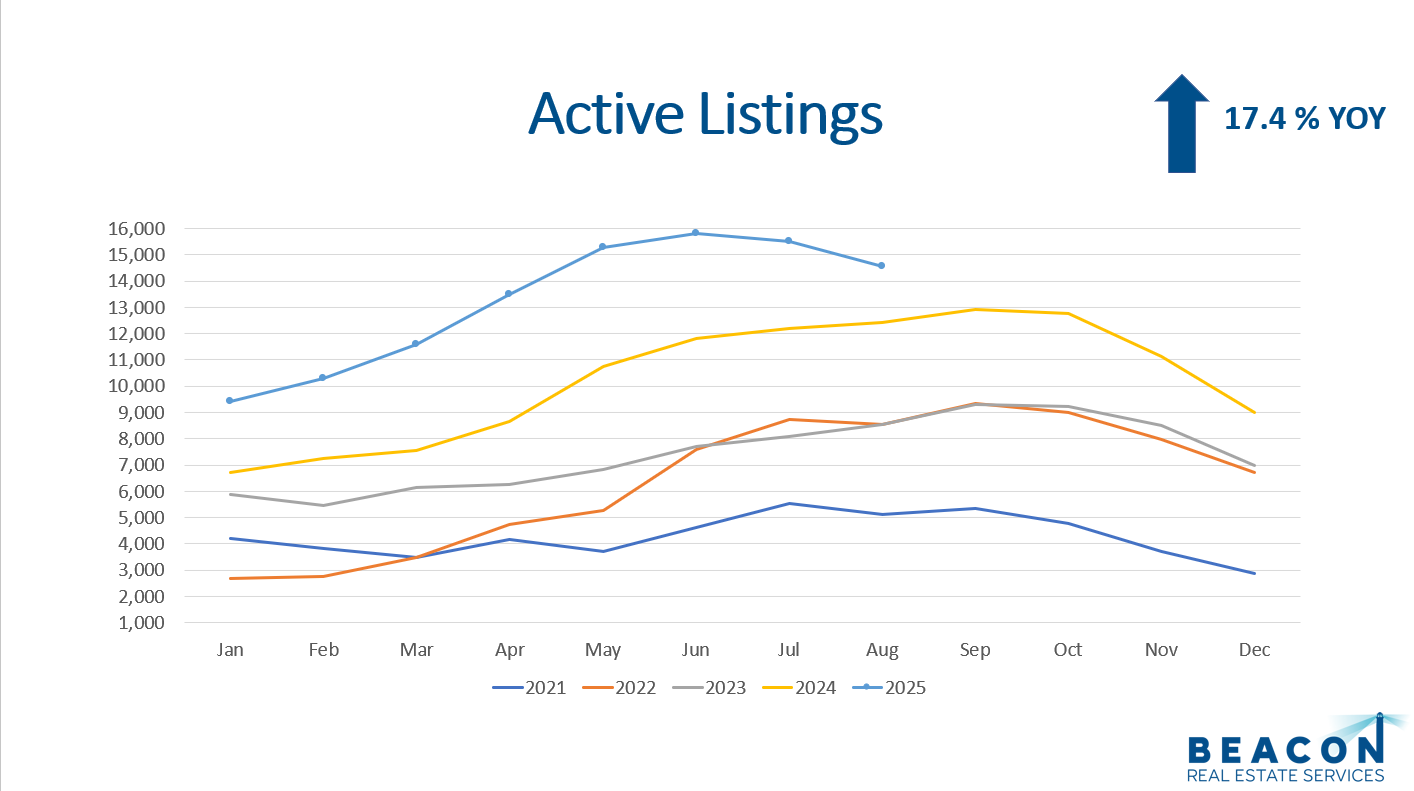
The total number of active listings at the end of August was 14,571. This continues the trend of historically high levels of inventory that has seemingly been transpiring since April of this year. Furthermore, the current inventory is up 17.4% compared to August 2024. The 10-year average for August active listings is 8,986, so we are significantly higher than that. The Denver market is experiencing a period of higher supply. This is good for buyers but poses a burden for sellers.
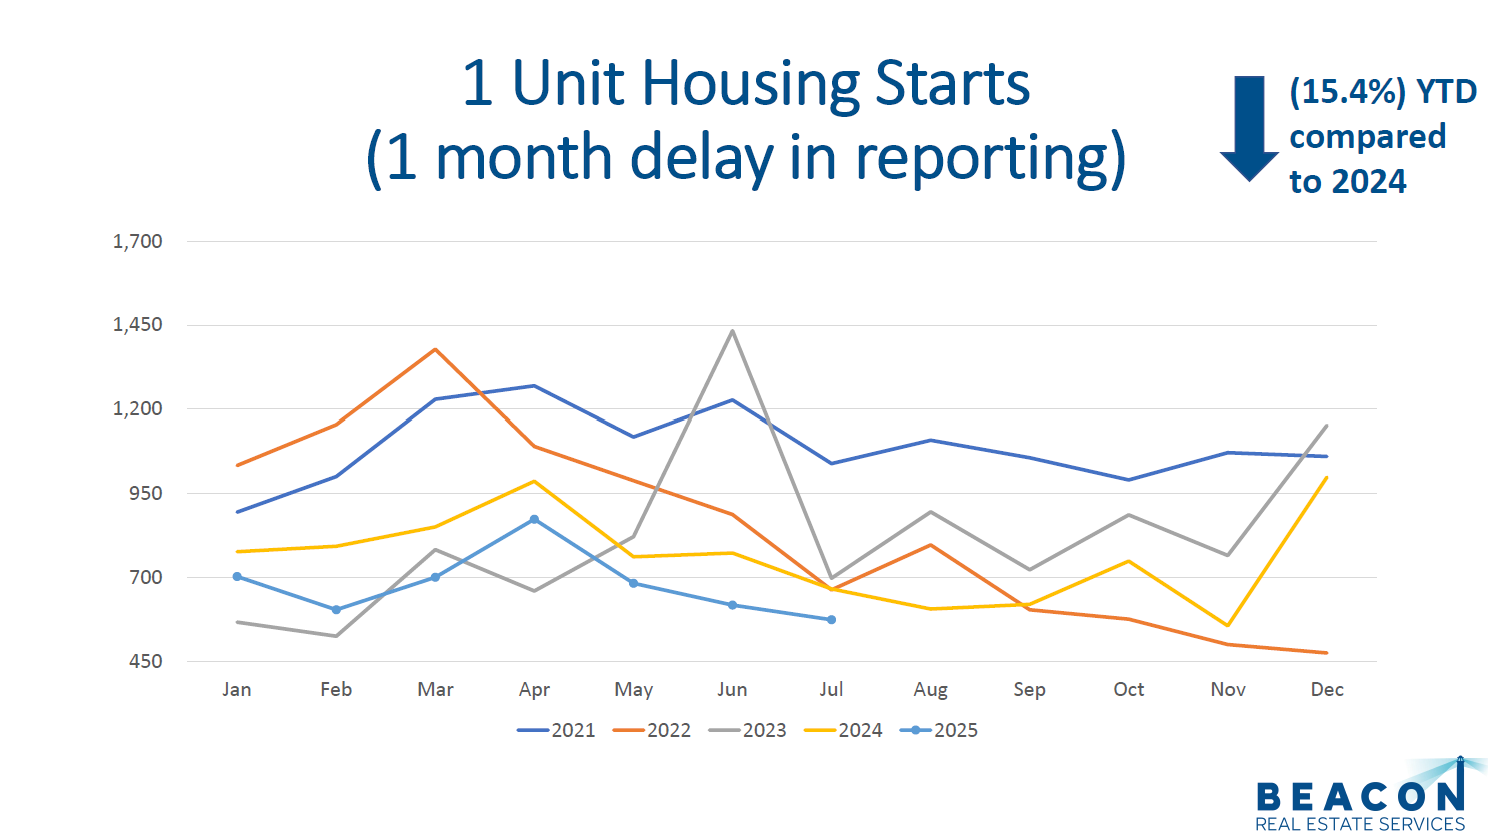
As the report has not been yet released for August, the most recent report for detached home construction is July 2025. The Denver Metropolitan Statistical Area (MSA) pulled permits on 363 homes. This is lower than the five-year average of 748 for July. The National Home Builders Association recently reported that 38% of builders surveyed are offering discounts.
Overall, the market has a surplus of supply and low demand. This is causing price stagflation and in some neighborhoods and product types, we are seeing values come down.
Demand
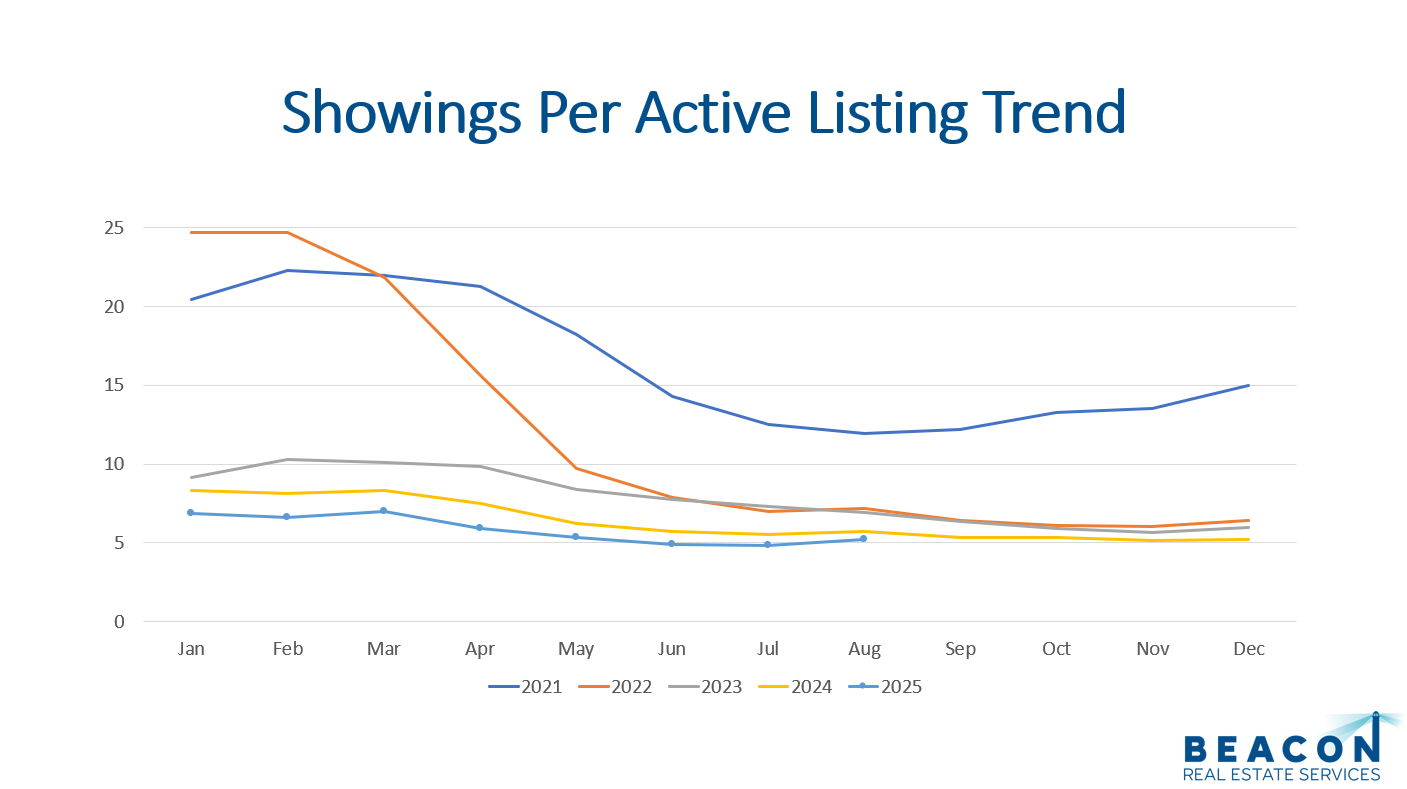
Showings are a great leading indicator for demand in the residential real estate market. There were 57,050 showings booked through ShowingTime in the Denver Metro Area during August. This is up 7.0% compared to August 2024 and also up 4.5% compared to July 2025. The average number of showings for August over the last six years is 75,770, highlighting that demand is weaker than historical averages.
Denver had 3,578 properties go under contract during August 2025, which is up 4.7% compared to August 2024.
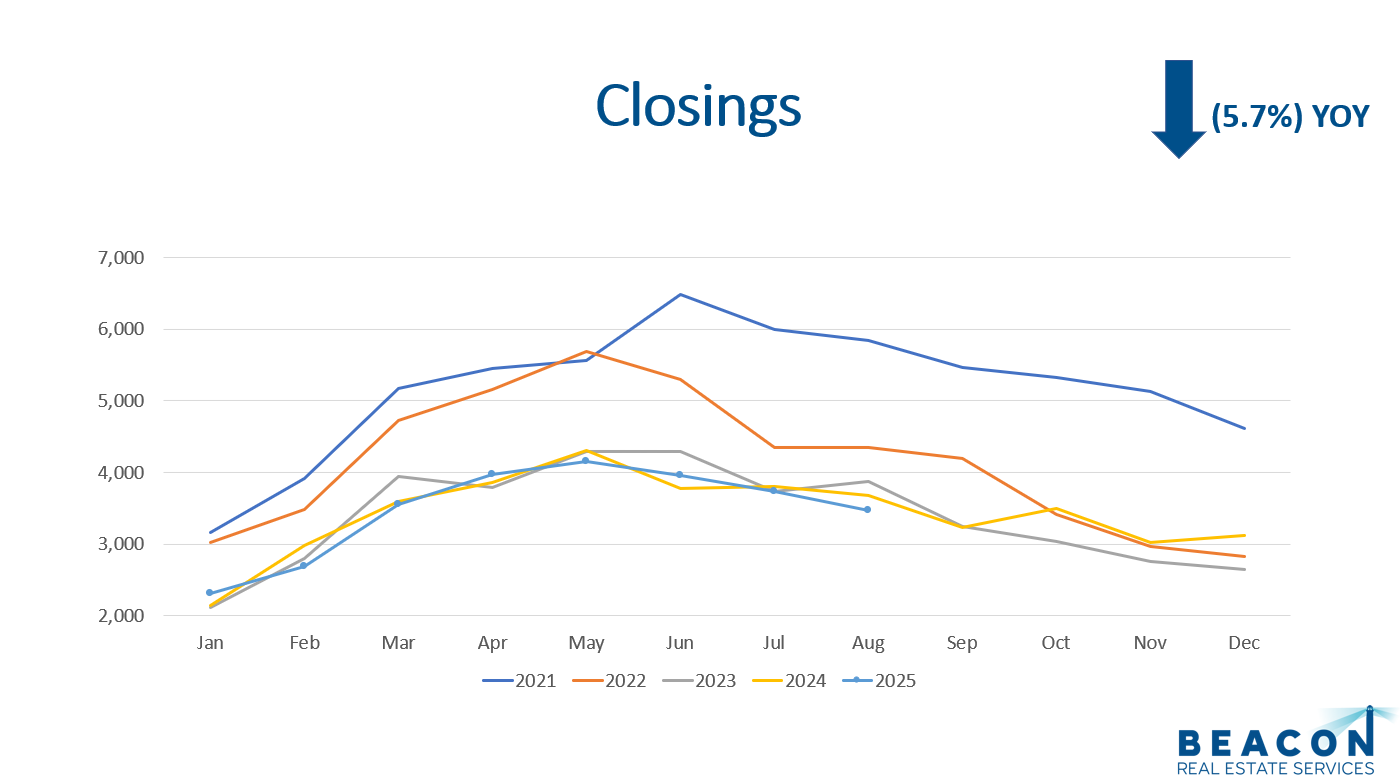
There were 3,469 closings in August 2025 compared to 3,680 in August 2024, reflecting a year-over-year decrease of (5.7%). When comparing this to July 2025, we saw a (7.1%) decrease.
The median days on the market for August increased to 30 days from 25 days in July 2025. Therefore, the market is still moving relatively quickly despite higher inventory levels. The current list price-to-close price ratio remained steady at 99.3%, indicating that sellers are generally receiving their asking prices. With that said, when we look at the original list price-to-close price ratio, we find a ratio of 96.70%. This means sellers are reducing their asking prices by nearly 3% before they receive an offer that is close to their asking price.
Therefore, demand remains soft but steady as we see continued pressure from higher interest rates and high property prices. The trend for 2025 appears to follow what we saw in 2023 and 2024. The lower level of transaction volume is very close to what we saw in during the tail end of the financial crisis.
Sales Prices
Long-term appreciation for Denver residential real estate averages around 6%, but current market conditions with higher prices, interest rates, and inventory are pushing some prices down. The current market is giving buyers more options than it did during the covid frenzy.
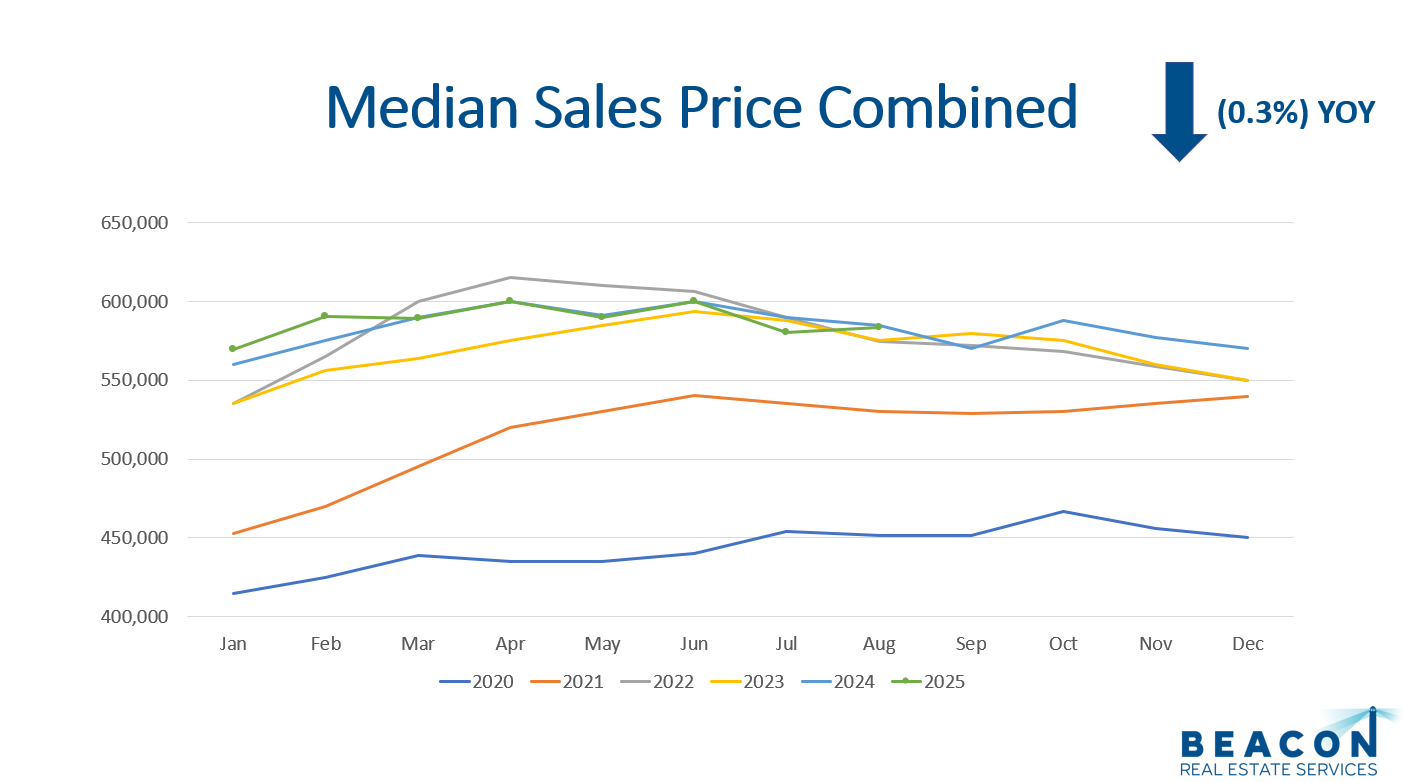
During August, the median sale price for attached and detached properties rose slightly from July to $583,500. However, this is down (0.3%) from a year ago. When compared to July 2025, the median price increased 0.6%.
Months of Inventory
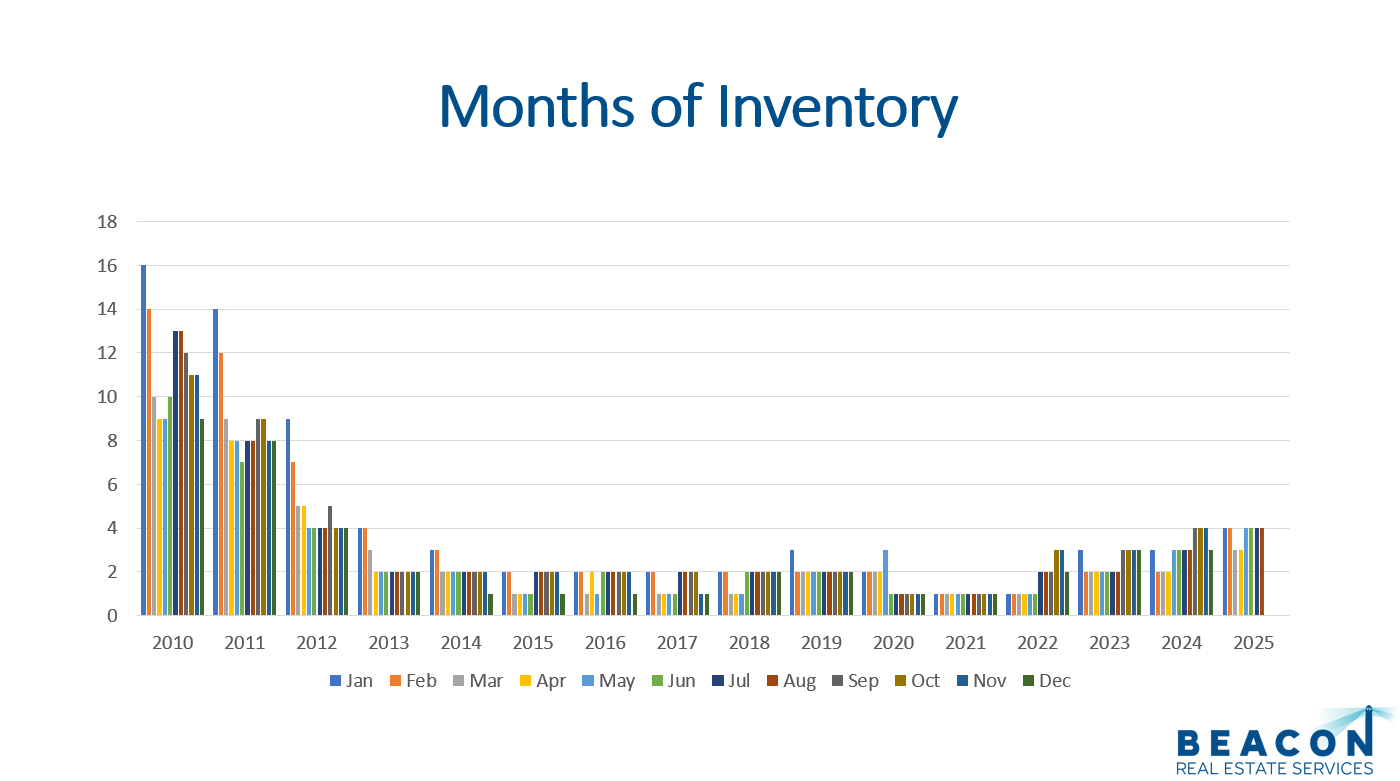
The months of inventory metric is a great indicator to watch for market trends. A seller’s market typically has 0-3 months of inventory, a balanced market has 4-6 months, and 7+ months indicates a buyer’s market. With 14,571 listings on the market and 3,469 closings in August, we have 4.0 months of inventory. If we measured inventory in weeks, that would be 18 weeks. August 2024 had 14.45 weeks. This places the market in a balanced position, which often leads to stable pricing trends.
Final Thoughts
In summary, supply, demand, median sales price, and months of inventory are key metrics to watch for understanding market trends. Supply is higher than it has been in years, providing buyers with more choices. Demand, while steady, is softer compared to historical norms due to high prices and interest rates. The median sales price shows some softening, but also slight rebounding from last month, due to increased inventory and tempered demand. Lastly, months of inventory indicate a balanced market, setting the stage for flat to moderate appreciation throughout 2025 even though August, as did July, showed some declines.
Here is a link to the full Market Presentation: