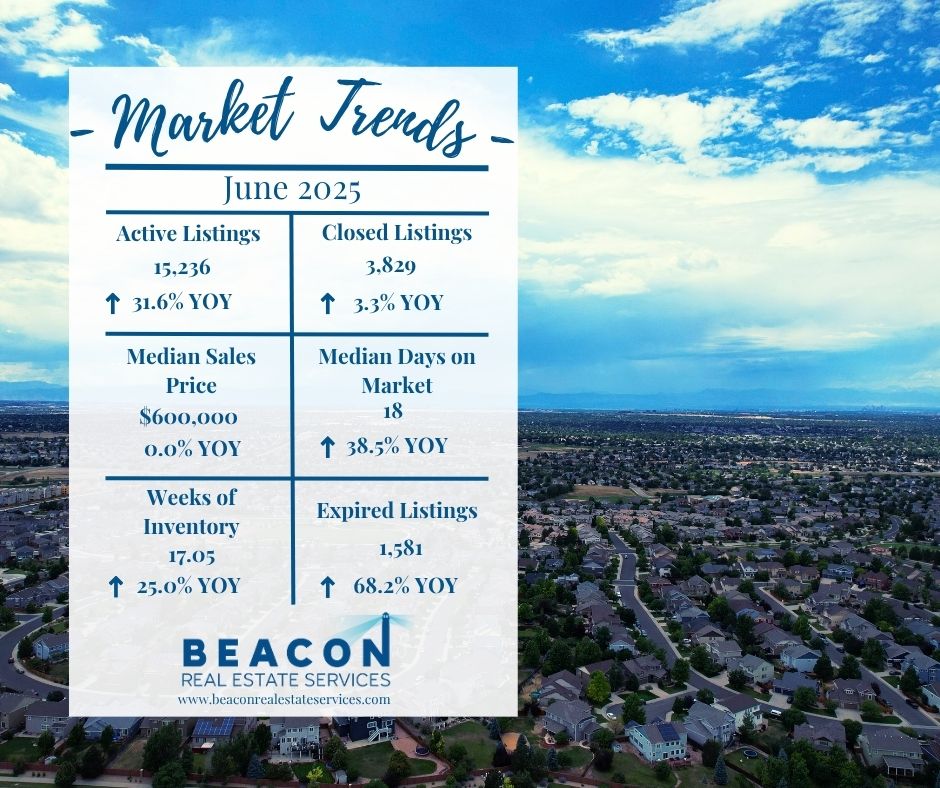
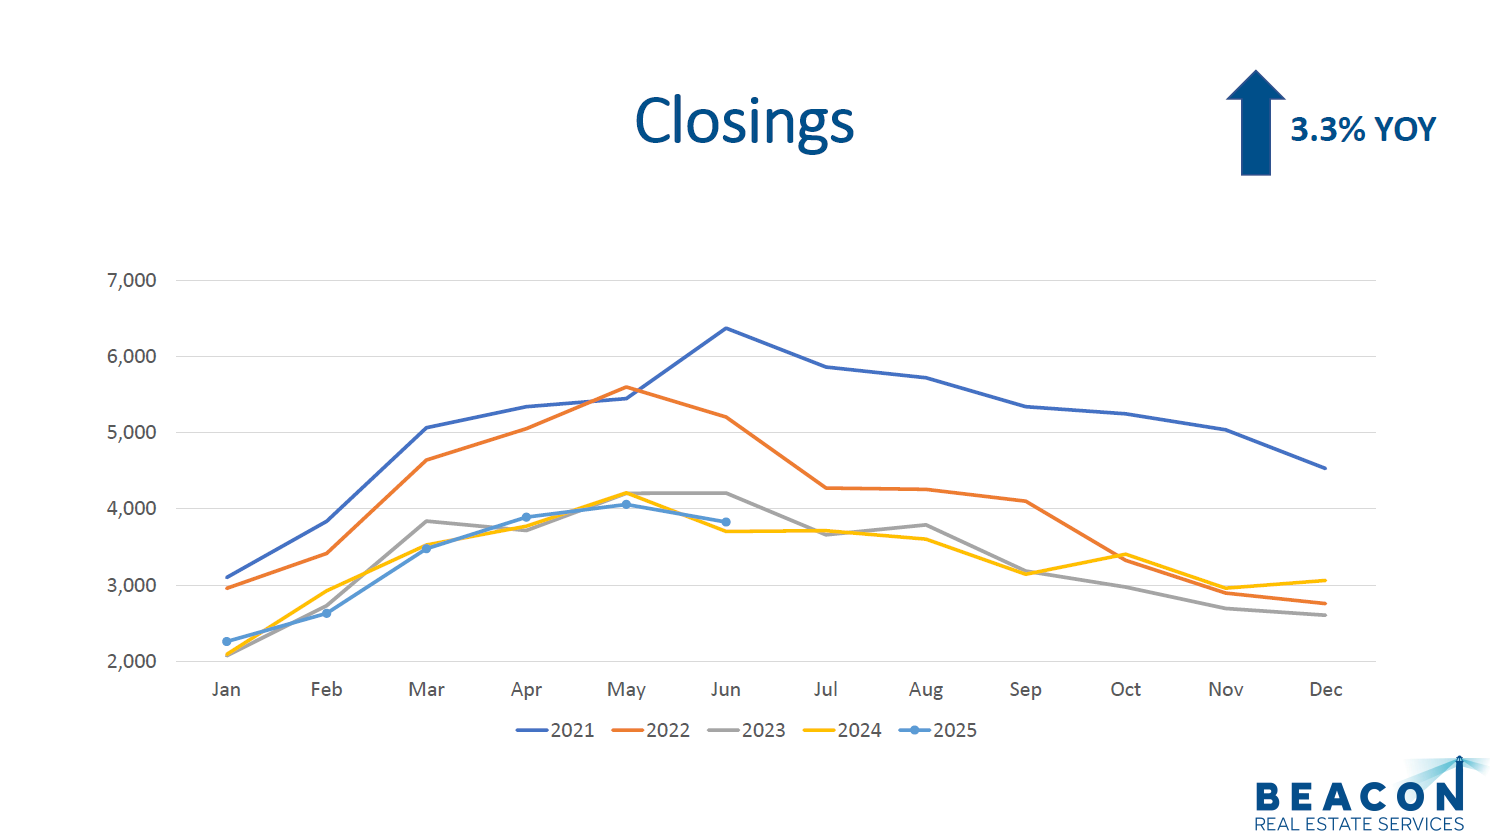
The Denver residential market is in a much different place than it was a few years ago. The 10-year average for new listings in June is 7,043, but we had 6,084 new listings during June. Although this is lower than the average, the total number of listings has climbed to 15,236. Furthermore, we saw 1,581 sellers give up on selling and let their listings expire. This is 68.2% more than June 2024 and more than double the long-term average. Meanwhile, the 10-year average for closings in June is 5,313, and we observed only 3,829 closings. This shows that buyer demand remains softer than average. The average 30-year mortgage rate, according to Freddie Mac, is 6.75%, which continues to reduce the volume of real estate sales. Let's dive into the key market data for the Denver residential real estate market to understand what is happening with supply, demand, sales prices, and months of inventory for June 2025.
Supply
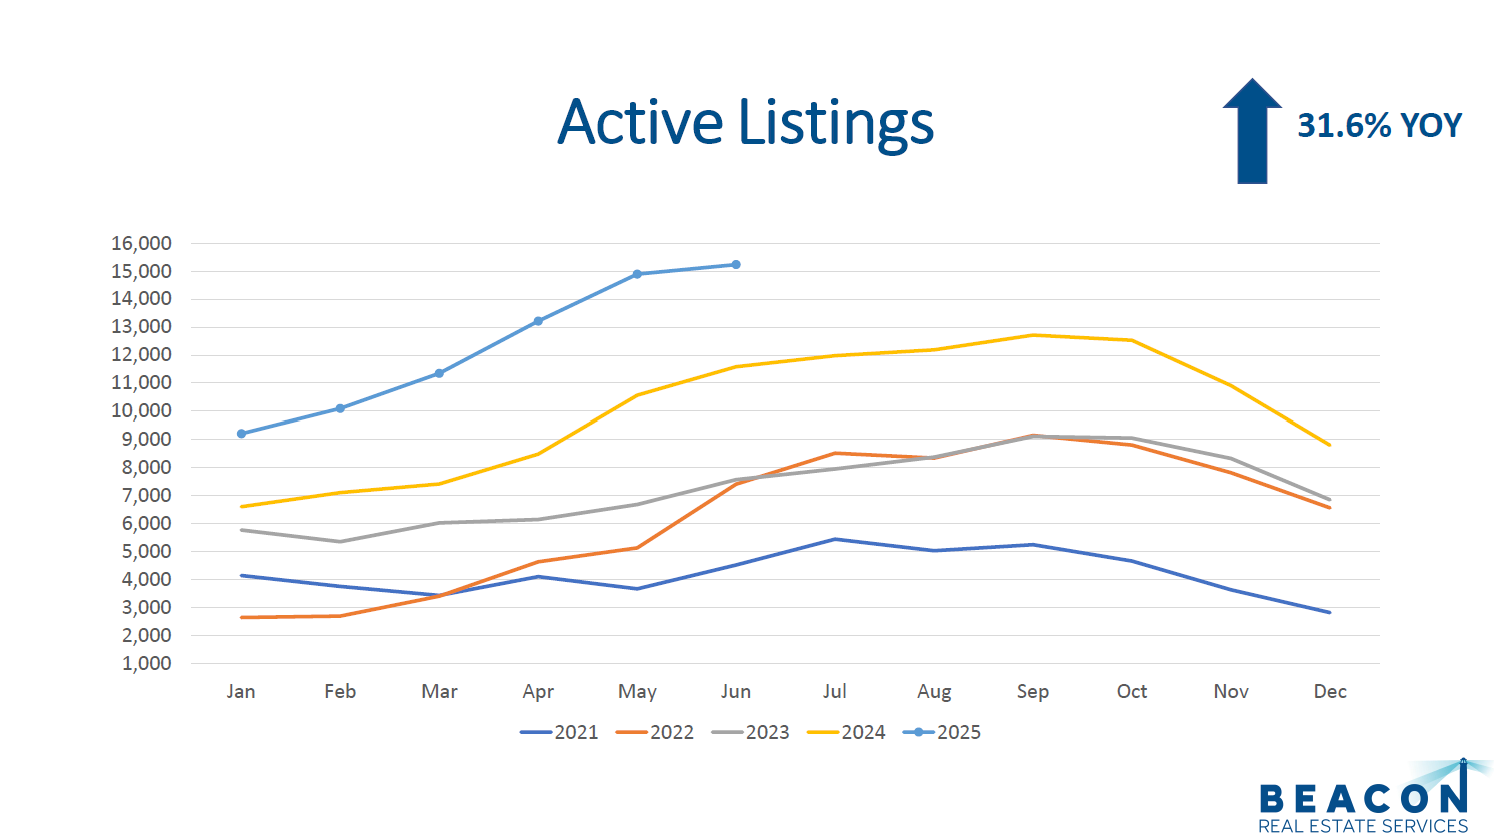
The total number of active listings at the end of June was 15,236. This is the highest amount of inventory since June of 2012! Furthermore, the current inventory is up 31.6% compared to June 2024. The 10-year average for June active listings is 8,302, so we are significantly higher than that. The Denver market is experiencing a period of higher supply. This is good for buyers but harder for sellers.
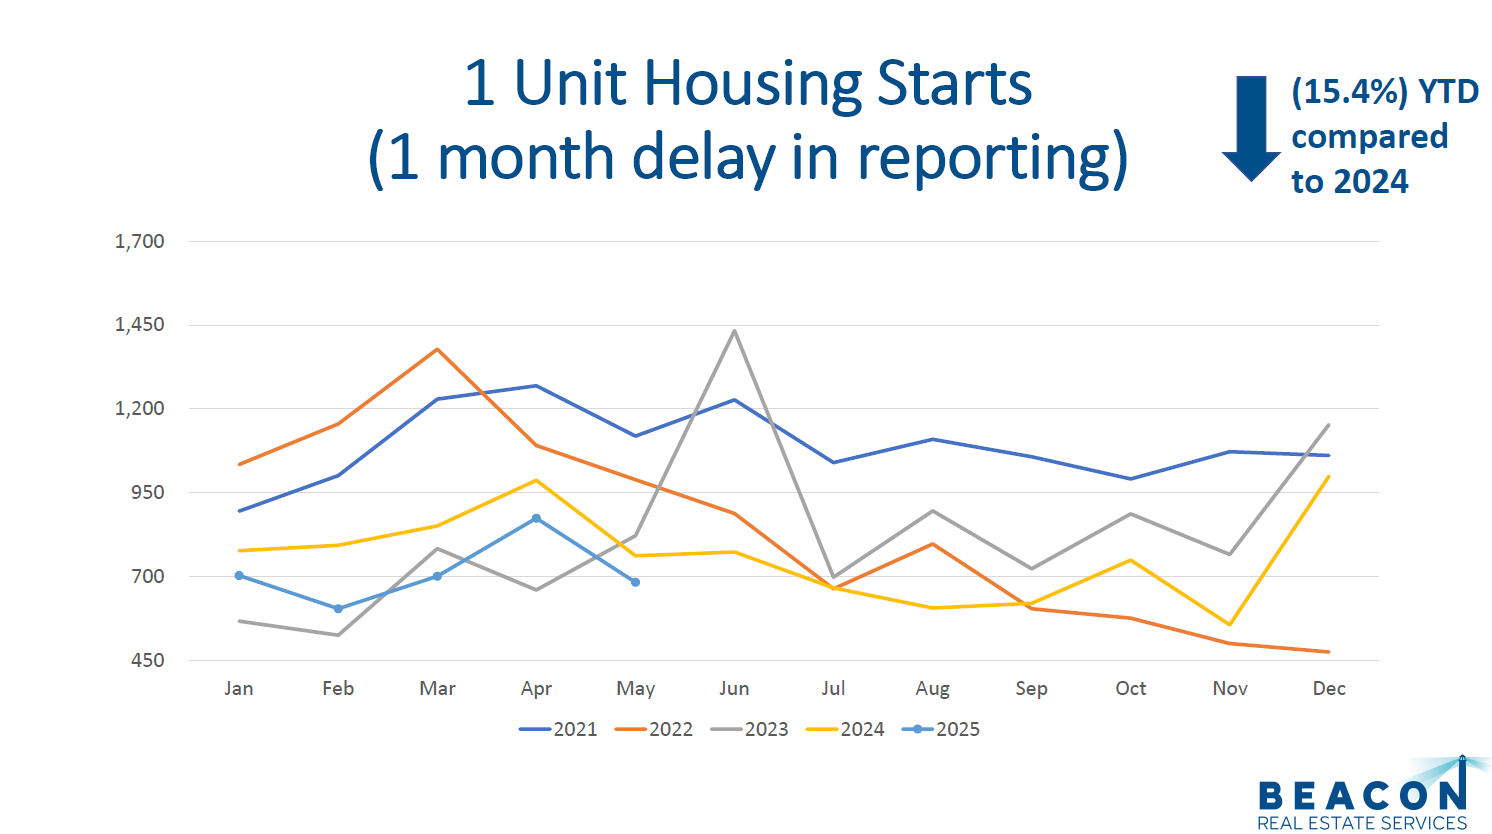
The most recent report for detached home construction starts is May 2025. The Denver Metropolitan Statistical Area (MSA) pulled permits on 683 homes. This is lower than the five-year average of 883 for May. The National Home Builders Association recently reported that 38% of builders surveyed are offering discounts.
Overall, the market has a surplus of supply. This is causing stable prices and low appreciation.
Demand
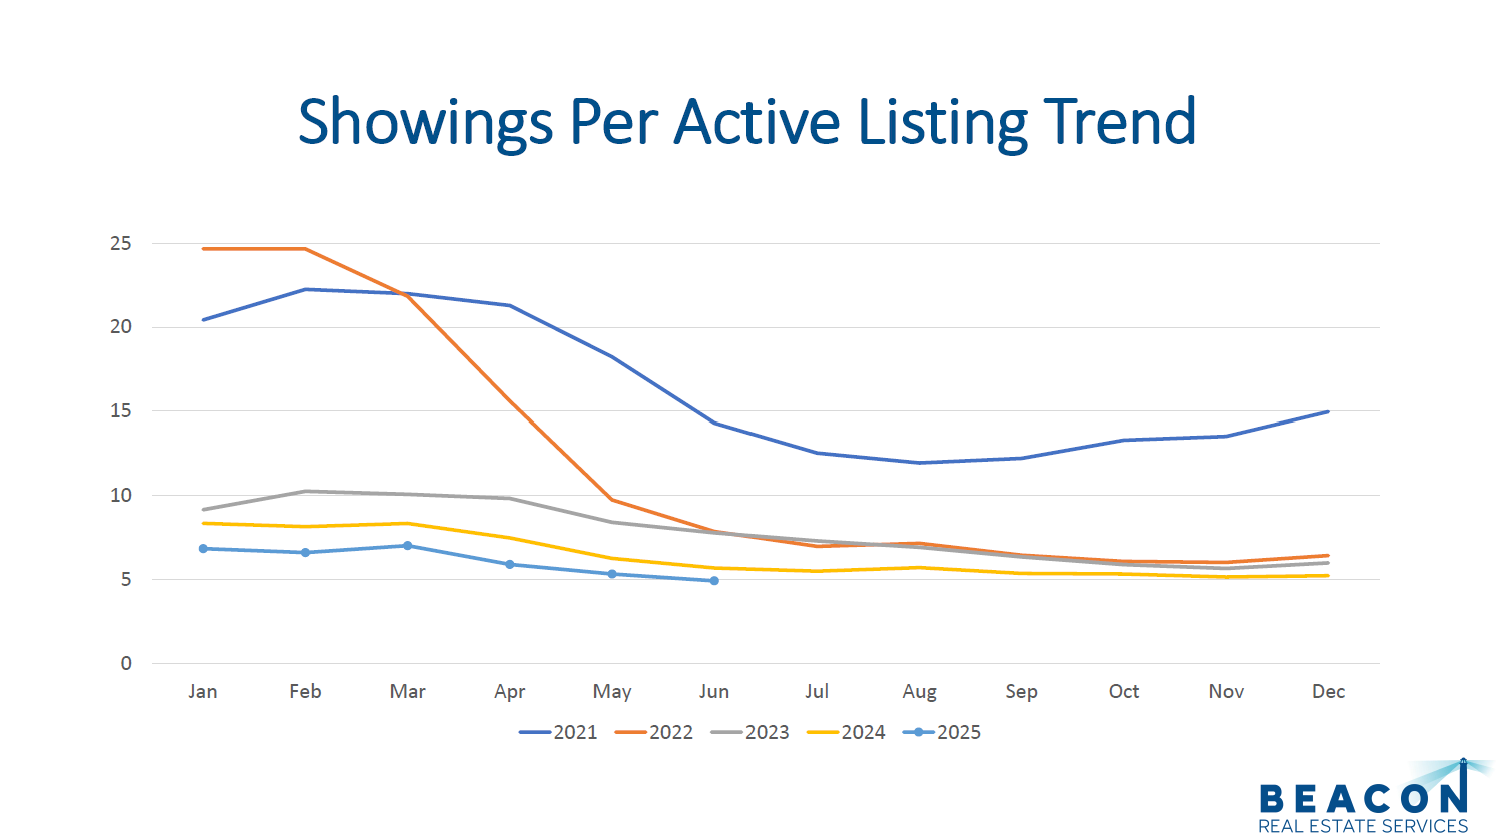
Showings are a great leading indicator for demand in the residential real estate market. There were 56,898 showings booked through ShowingTime in the Denver Metro Area during June. This is up 3.0% compared to June 2024 but down (3.2%) compared to May 2025. The average number of showings for June over the last six years is 79,974, highlighting that demand is weaker than historical averages.
Denver had 3,721 properties go under contract during June 2025, which is up 2.1% compared to June 2024 but down (2.8%) compared to May.
There were 3,829 closings in June 2025 compared to 3,705 in June 2024, reflecting a year-over-year increase of 3.3. Compared to May 2025, this represents a (5.7%) decrease, following the typical seasonal pattern of higher spring activity.
The median days on the market for June increased to 18 days from 13 days in May 2024. Therefore, the market is still moving relatively quickly despite higher inventory levels. The current list price-to-close price ratio remained steady at 100.00%, indicating that sellers are generally receiving their asking prices. With that said, when we look at the original list price-to-close price ratio, we find a ratio of 98.10%. This means sellers are reducing their asking prices by nearly 2% before they receive an offer.
Therefore, demand remains steady but continues to face pressure from higher interest rates and property prices. The trend for 2025 appears to follow what we saw in 2023 and 2024. The lower level of transaction volume is very close to what we saw in 2010, 2011, and 2012 (during the tail end of the financial crisis).
Sales Prices
Long-term appreciation for Denver residential real estate averages around 6%, but current market conditions with higher prices, interest rates, and inventory are moderating short-term gains. The current market is giving buyers more options than it did during 2020, 2021, and 2022.
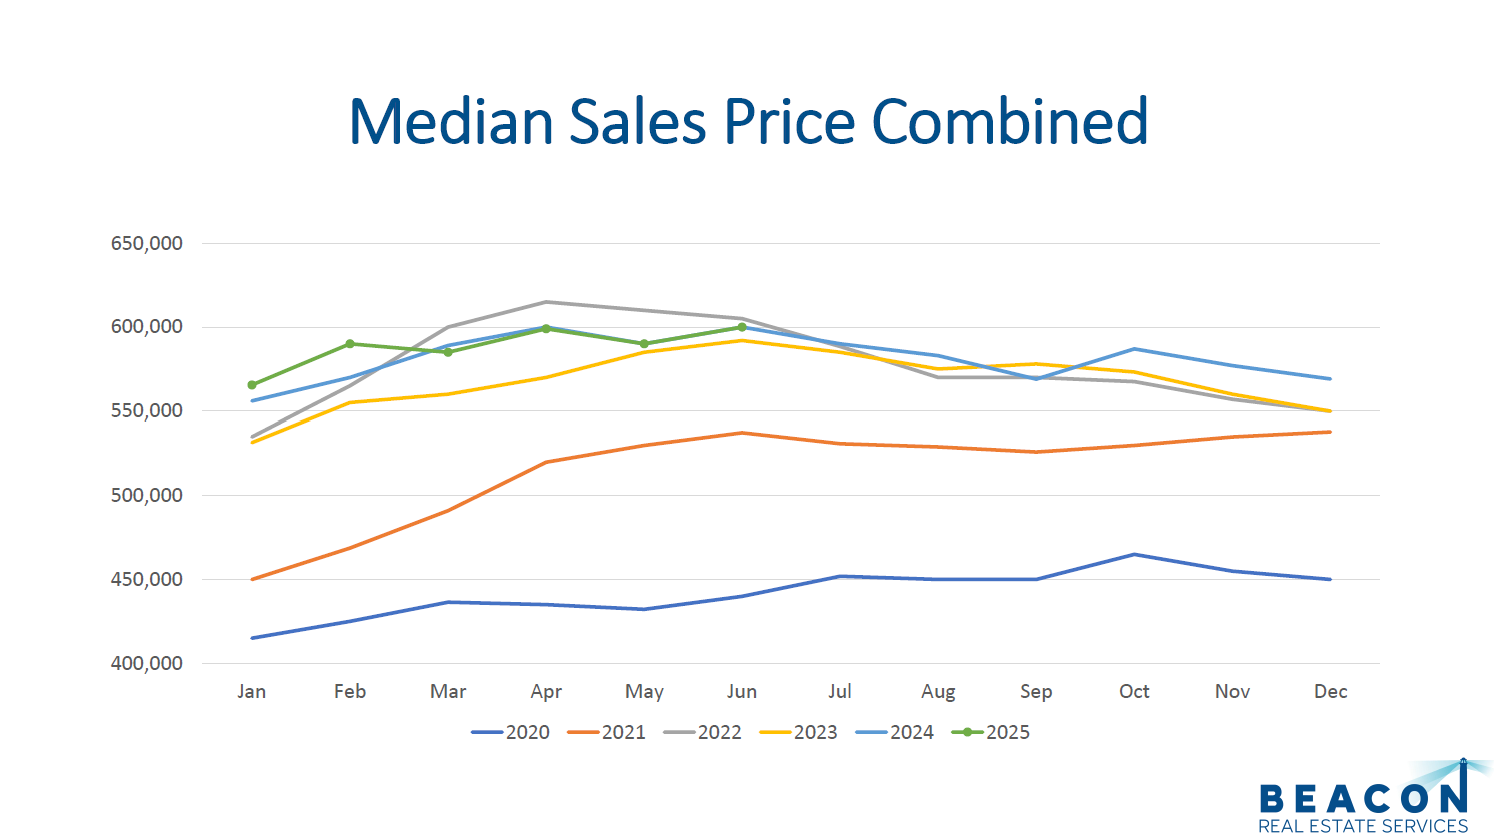
During June the median sale price for attached and detached properties was $600,000. This is almost exactly where we were in June 2024 with $599,990. This stability in prices reflects a balanced response to the increase in supply and steady demand. When compared to May 2025, the median price increased 1.7%.
Months of Inventory
The months of inventory metric is a great indicator to watch for market trends. A seller’s market typically has 0-3 months of inventory, a balanced market has 4-6 months, and 7+ months indicates a buyer’s market. With 15,236 listings on the market and 3,829 closings in June, we have 4.0 months of inventory. If we measured inventory in weeks that would be 17.05 weeks. June 2024 had 13.64 weeks. This places the market in a balanced position, which often leads to stable pricing trends.

Final Thoughts
In summary, supply, demand, median sales price, and months of inventory are key metrics to watch for understanding market trends. Supply is higher than it has been in years, providing buyers with more choices. Demand, while steady, is softer compared to historical norms due to high prices and interest rates. The median sales price shows stability, suggesting that the market remains resilient even with increased inventory. Lastly, months of inventory indicate a balanced market, setting the stage for flat to moderate appreciation throughout 2025.
To view the full presentation, click here: Denver Metro Residential Market Update June 2025.pdf