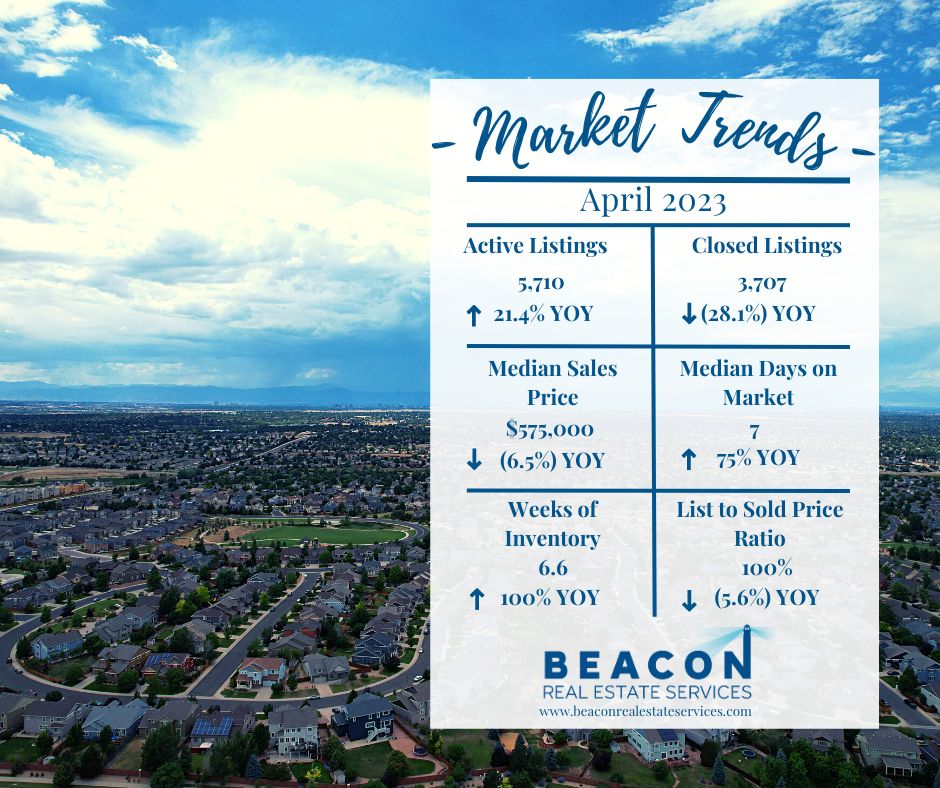
Year to date residential real estate closings in Denver are down (23.6%) compared to the same time period in 2022. The volume of new listings coming on the market slowed from a strong pace in March. Mortgage interest rates with a 30-year term ended April at 6.43%. Let’s dive into the key market data for the Denver residential real estate market to see what is happening with supply, demand, sales prices, and months of Inventory for April 2023.
Supply
In April we had 5,079 new listings hit the market! Although this is much better than January and February this is down (7.4%) compared to March and down (28.5%) compared to April 2022.
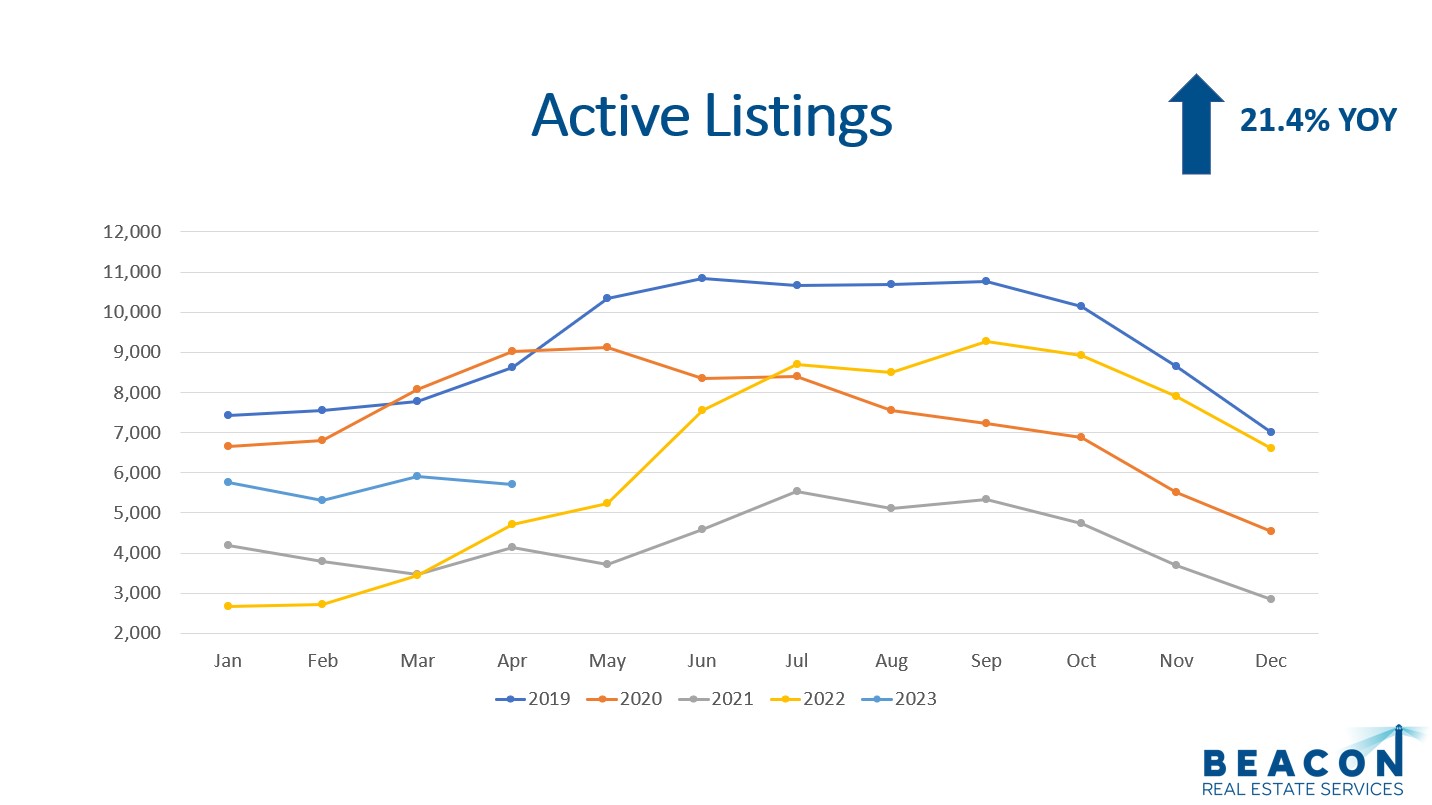
The total amount of active listings at the end of the month came in at 5,710. This is up 21.4% from April 2022 but is down (3.4%) compared to April 2022. The 10-year April average from 2013 to 2022 is 7,405 listings, so we are below our long-term average.
The most recent report for detached home construction starts is March 2023. The Denver Metropolitan Statistical Area (MSA) pulled permits on 783 homes. This is a good jump from January and February and close to the number of permits pulled in March of 2020. The cost of interest rates, materials, labor, and land have slowed new construction development for homes.
All in all, the supply is in a better position compared to 2021 and 2022 but is still lower than 2019 and 2020.
Demand
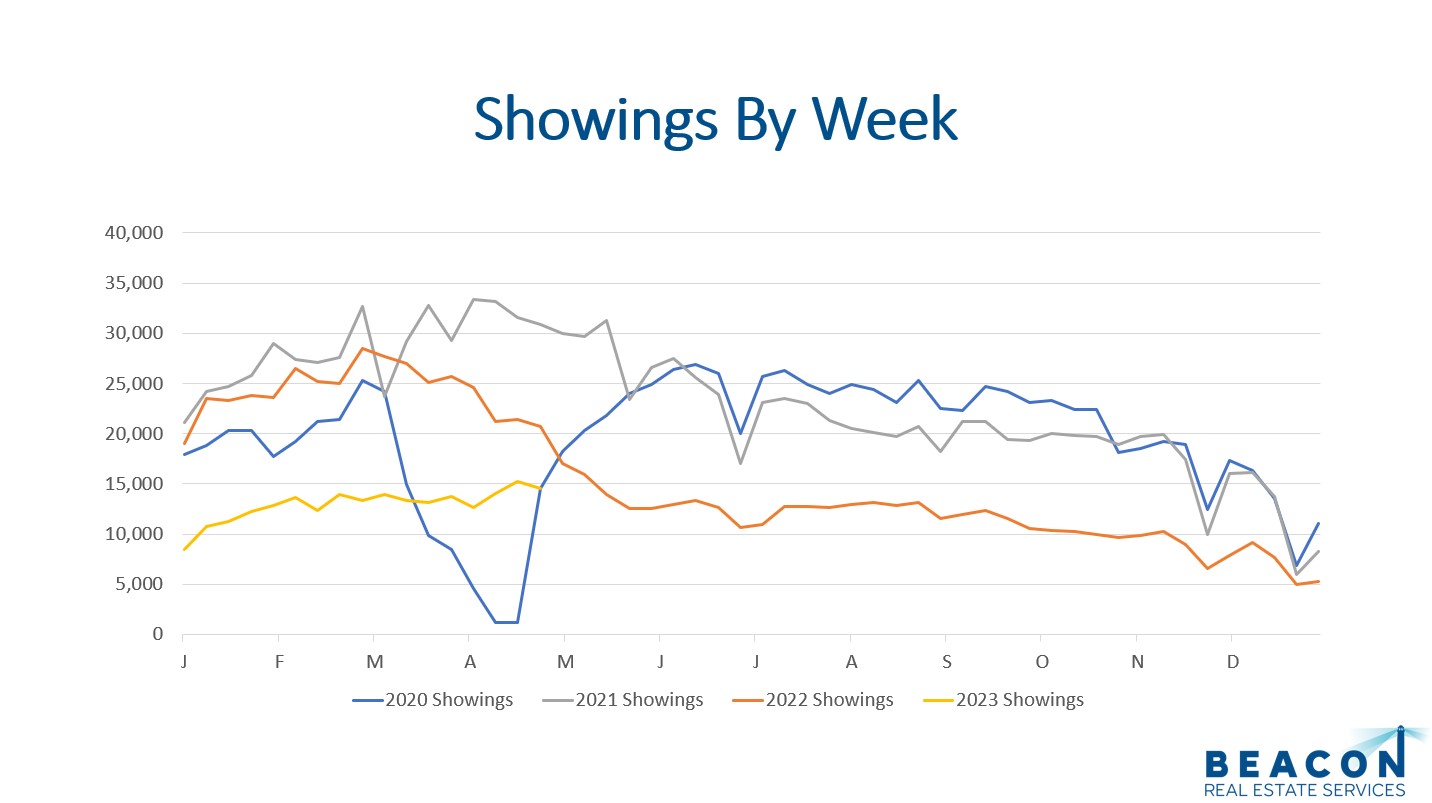
Showings are a great leading indicator for demand in the residential real estate market. There were 62,466 showings booked through the largest showing service in the Denver metro area during April. This is up 5% compared to March but down (40.1%) compared to April 2022. The average amount of showings in April, for the prior four years, was 90,342. This includes only 20,685 showings in April 2020 when covid locked up the market. If we take out covid, the average was 113,560 showings for April.
Denver had 4,424 properties go under contract in April 2023. This is up 12.3% compared to March but is down (16.7%) compared to April 2022.
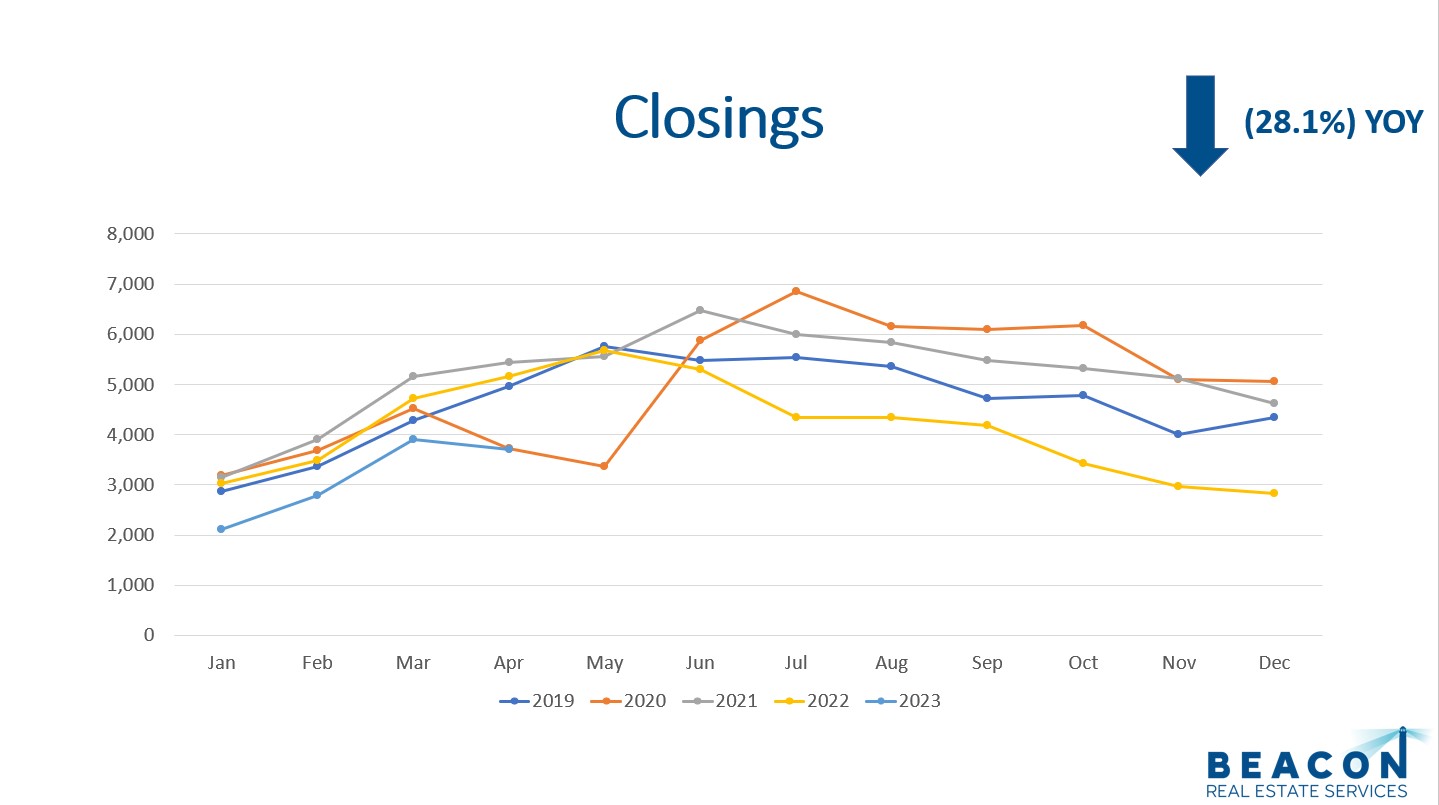
There were 3,707 closings in April 2023 compared to 3,912 in March 2023. This is a (5.2%) decrease month over month. A year ago, we had 5,157 closings in April so the volume of closings is down (28.1%) YOY.
The median days on market for April 2023 dropped to 7 days from 34 days in January. This is another encouraging sign for the residential market! This means half of the properties listed are sold in 7 days or less.
The list price to close price ration is at 100%, so sellers are getting what they are asking as long as the house is priced right.
All in all, demand for housing is picking up but is still somewhat rocky. Let’s look at the median sales price.
Sales Prices
The median sales price for April was $575,000. This metric includes detached and attached properties. The median price increased 2.2% over March but is down (6.5%) from April 2022. April 2022 marked our highest median sales price ever.

The long-term average appreciation for residential real estate is 6%. Higher prices and higher interest rates will continue to limit appreciation. Tight inventory is helping to prop up the market.
Although prices are down from last year, we are encouraged to see the median price increasing as we get into the spring selling season.
Let’s look at months of inventory now.
Months of Inventory
The months of inventory is a great indicator to watch for market trends. Typically, a seller’s market has 0-3 months of inventory. A balanced market has 4-6 months of inventory, and 7+ months of inventory is a buyer’s market. In a seller’s market prices go up. In a buyer’s market prices go down.
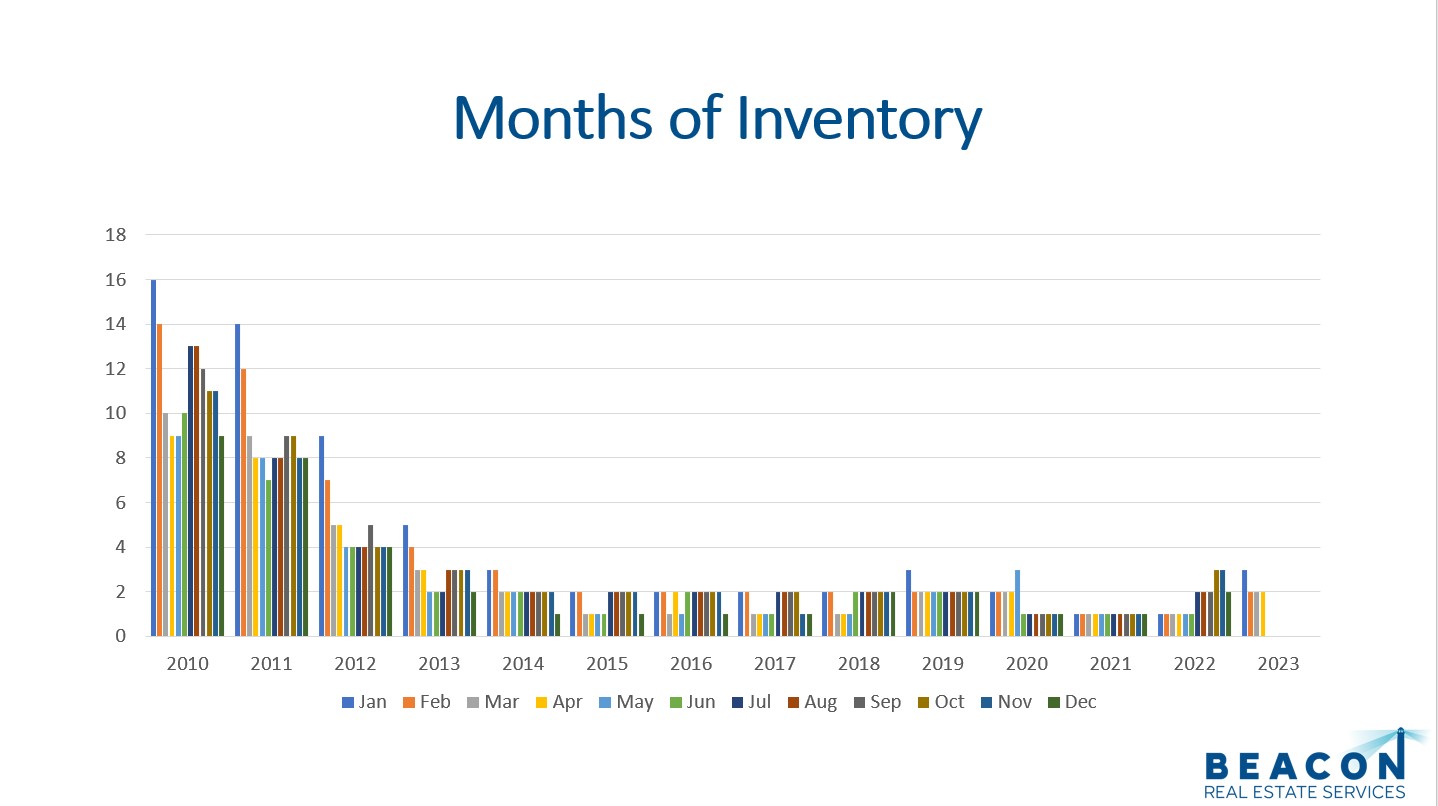
With 5,710 listings on the market and 3,707 closings, the months of inventory stayed at 1.5 months or 6.6 weeks of inventory. Therefore, the inventory is still low when compared to the demand. We expect the months of inventory to continue to be low this year.
All in all, months of inventory is a great metric to watch.
Final Thoughts
In conclusion, supply, demand, median sales price, and months of inventory are ideal key performance indicators to watch for market trends. Supply is higher than the record lows of 2021 and 2022 but is still lower than the long-term average. Demand was higher in April compared to January and February but is still lower than the previous four years. With the 30-year mortgage interest rate ticking down slightly, that helped the market. Lastly, 1.5 months of inventory still puts sellers in the driver’s seat.
Here is a link to the full presentation: