The Denver Metro residential real estate market saw record high showings, for this time of year, and record low inventory! Historically, the inventory levels are lower in January, February, and March with more homes coming on the market in April, May, and June. Let’s jump into Demand, Supply, Average Sales Price, and Months of Inventory for this review.
Demand

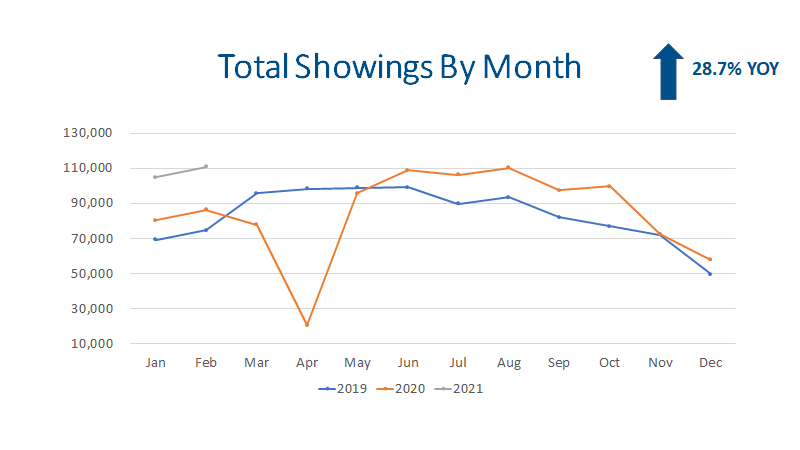
The best measurements for demand are showings and contracts. There were 110,984 showings in February according to ShowingTime.com’s data. This represents an increase of 24,719 showings over last year, which is a 28.7% YOY increase. February 2020 had 86,265, and February 2019 had 74,604.
There were 4,744 buyers that offers accepted during the month. This represents a 14.3% increase YOY. Contracts typically close in 30 days, so we can expect most of these contracts to close in March.
Supply

I would love to be talking about how a bunch of people were ready to sell but that is not what happened... Buyers still have a reduced number of options compared to previous years.
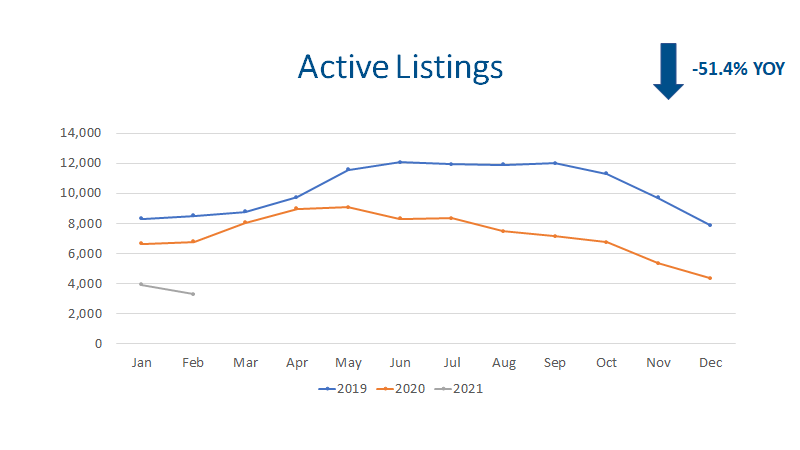
We had 3,301 active listings in February. To put this in perspective, in February of 2010 we had 33,215 active listings which was 10 times the number of listings that we have today!
The February inventory level represents a (51.7%) decline YOY.
Average Sales Price

Low mortgage interest rates, strong buyer demand, and record low inventory have all contributed to new record high sales prices.
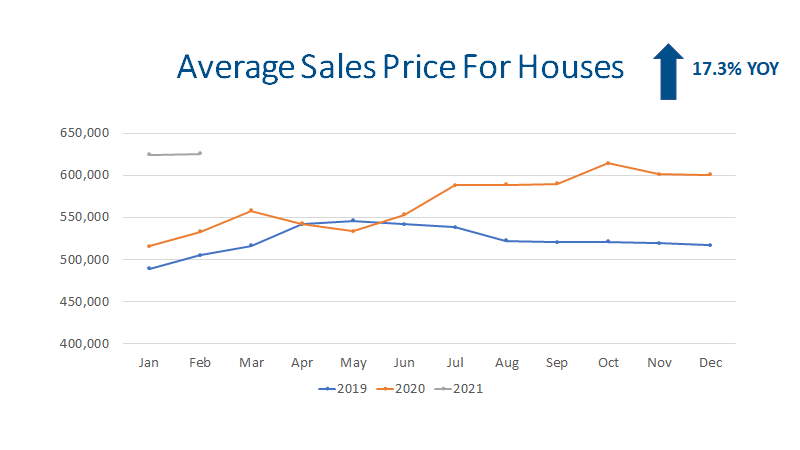
Single family detached homes had an average sales price of $625,366, which was very similar to January 2021. This represents an increase of 17.3% YOY. This may be a little misleading stat but not by too much. Expensive homes are still selling at a similar rate but entry level homes do not have the same volume. Thus, the “averages” move up.
Attached single family properties (condos and town homes) saw a 10.9% increase from $376,380 in February 2020 to $417,503 in February 2021 on average. This seems to be a better reflection of appreciation.
The average sales price for the entire market rose to $546,760. This represents an increase of 14.6% compared to February 2020.
Months of Inventory

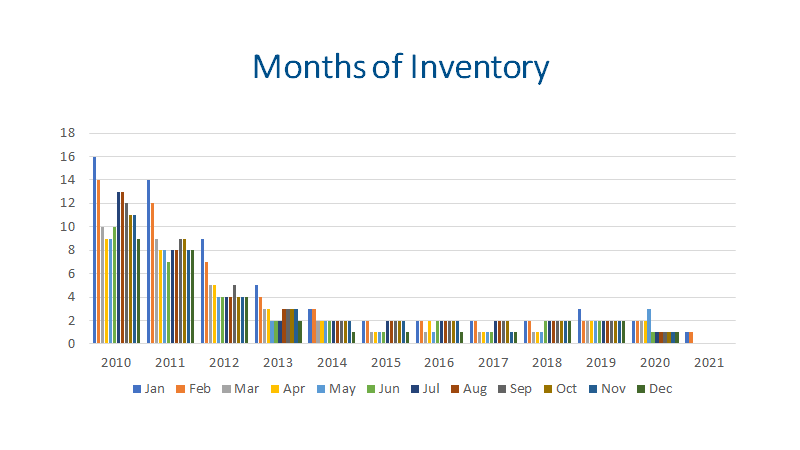
Months of inventory is a great indicator to focus on. A seller’s market has 0-3 months of inventory. A balanced market is 4-6 months of inventory, and 7+ months of inventory is a buyer’s market. A seller’s market will see prices going up. A balanced market is price stability to modest growth, and a buyer’s market will see prices decline.
February 2021 has only 1 month of inventory according to Recolorado.com’s data. If we do the math the inventory actually dips below 1 month. With 3,301 active listings and 3,826 closings, we have a little over 3 weeks of inventory.
Final Thoughts and Risks
All in all, demand, supply, average prices, and months of inventory are all great indicators to watch when monitoring the real estate market. New record highs for showing activity and contracts indicate strong demand. Record low inventory indicates sellers are still reluctant to sell. There is a good possibility that inventory will go up with the Spring and the continued vaccination efforts. Prices continue to rise due to strong demand, low inventory, and low mortgage interest rates. The months of inventory are still low.
The full presentation slides can be found here:
Denver Metro Residential Market Update February 2021.pdf