The Denver residential real estate market continues to be quite vibrant. Most of us have heard of the low supply of homes on the market, but have you heard of the nationwide housing shortage? The National Association of Realtors (NAR) hired the Rosen Consulting Group (RCG) to complete a study. The Rosen Group found that, as a Country, we are underdeveloped by 5.5 Million housing units when comparing housing starts to household formation. The NAR article can be found here. The RCG white paper can be found here. This is result of a perfect storm. Many millennials put off buying a home as they tried to survive during the Great Recession as they watched millions of people lose their homes and jobs. Also, the costs, labor, time, water, and regulations have all played a role in limiting new home production. We would love to work on this HUGE problem but for today let’s look at Supply, Demand, Average Sales Price, and Months of Inventory for June 2021.
Supply
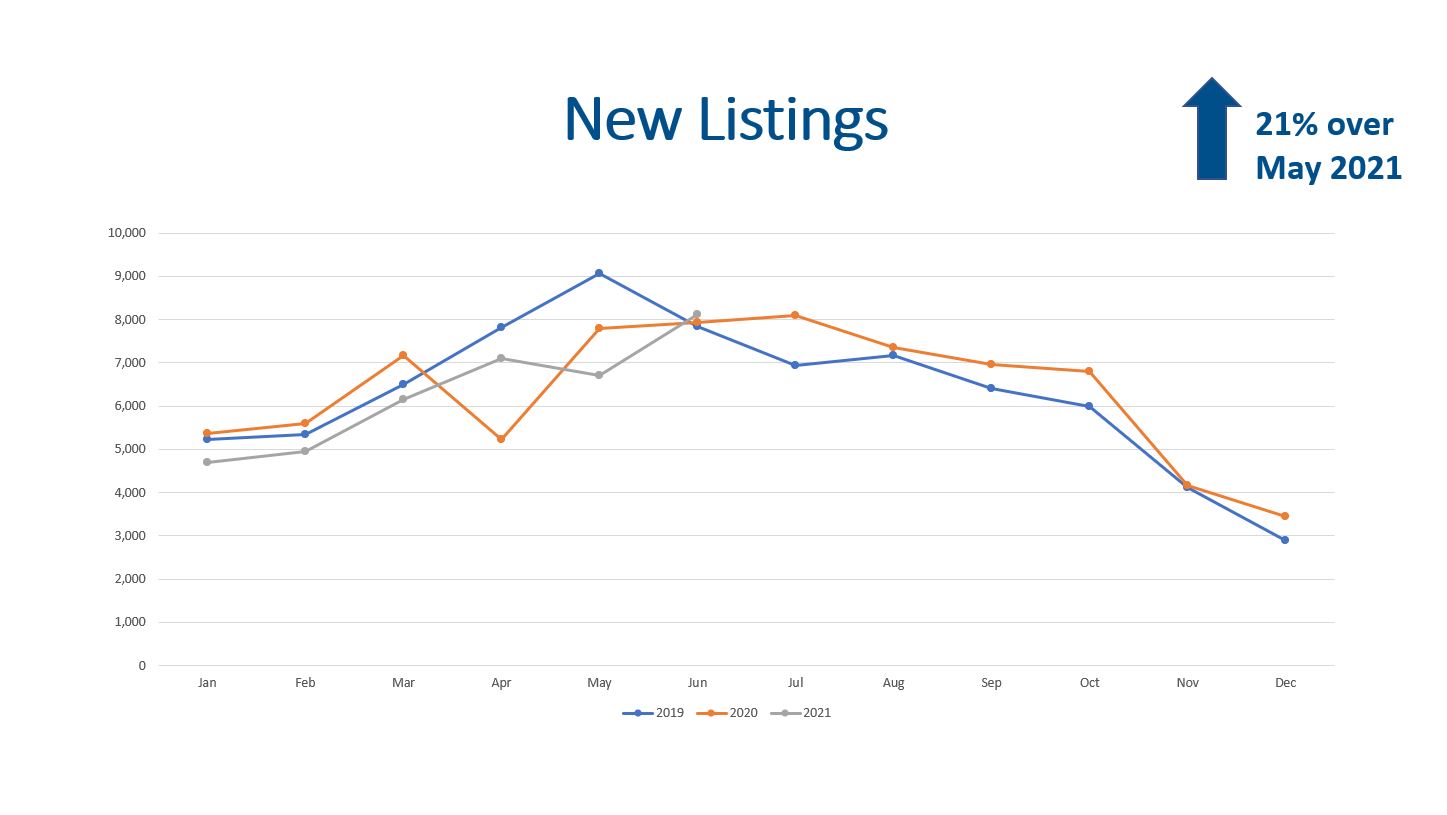
We added a new supply metric this month to observe the total new listings! This market is moving so fast that many properties are listed and under contract in just a few days.
June saw 8,116 new listings, which is an increase of 21% compared to the number of new listings in May. This brought a little relief to buyers. With that said, we were really close to where we were in 2020 and 2019.
We ended June with 3,982 homes on the market. Although this represents a 14.5% increase over May, we are down (52.2%) compared to June of 2020 and down (82.1%) compared to June of 2019.
Hopefully, we continue to see more homes come on the market in July and August.
Demand
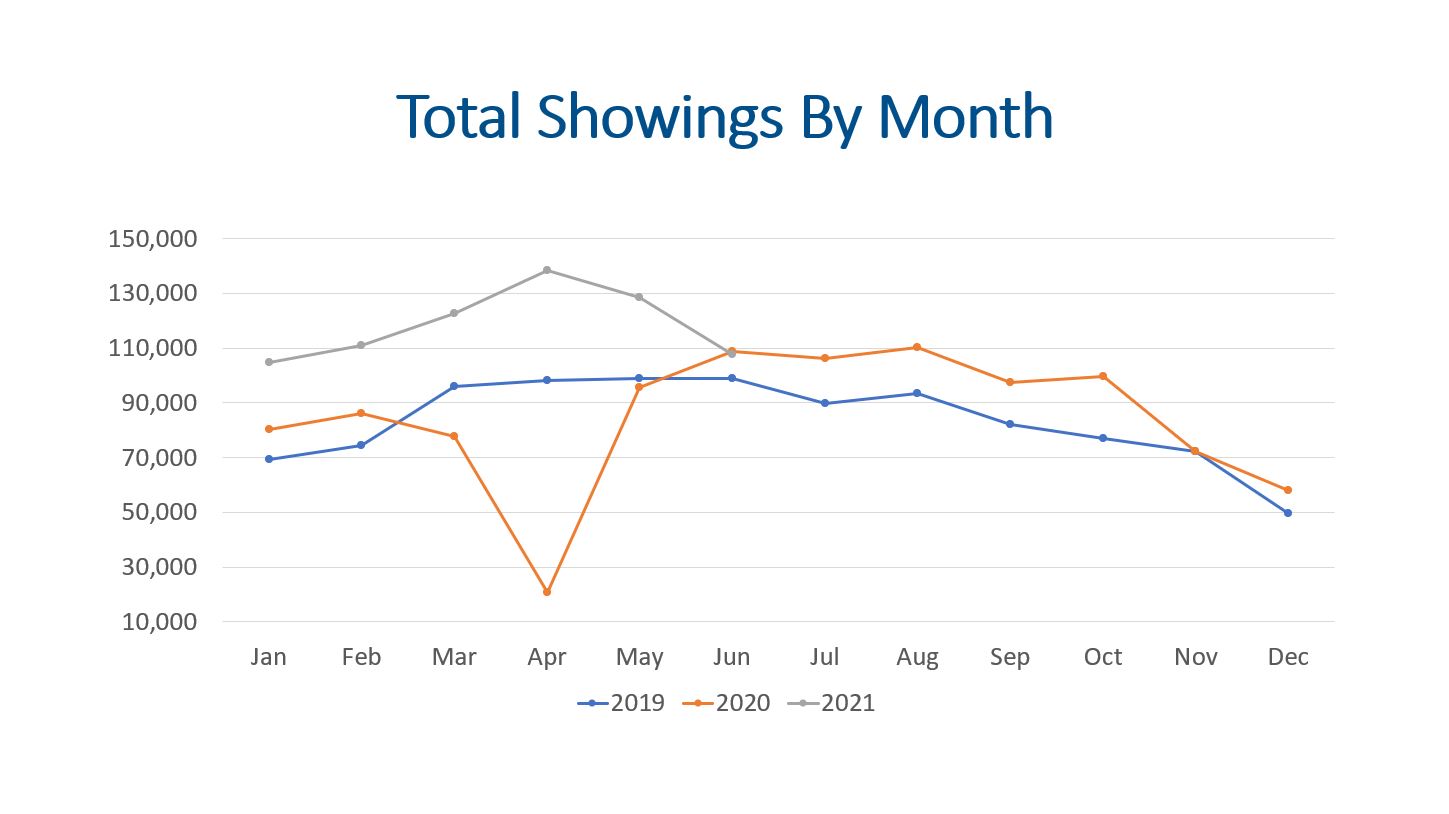
Showings are the leading indicator of market health. Several news outlets and agents have been talking about a decrease in showings. Yes, it is true that total showings are down compared to May, but we need to look at the data and think about what is happening.
Total showings from January through May in 2020 were 360,954 and the total during the same time period in 2021 were 605,729! This means total showing volume was up 67.8% when comparing 2021 to 2020. Of course, we know the lockdowns did suppress showings in the Spring last year.
For June of 2021, we had 107,884 showings which is 16% less than last month, but we were within 1% of the total showings for June of 2020.
The next step after showings for a buyer is to try and get a contract accepted by a seller. This will change the status from Active to Pending. There were 6,444 buyer contracts accepted by sellers in June. This is up from last month but a little lower than the same time last year.
Final step for a buyer is to close on the contract. This usually happens with 30-40 days of going under contract. In June, there were 6,266 closings which is a modest 6.8% increase over the same time last year.
Average and Median Sales Price
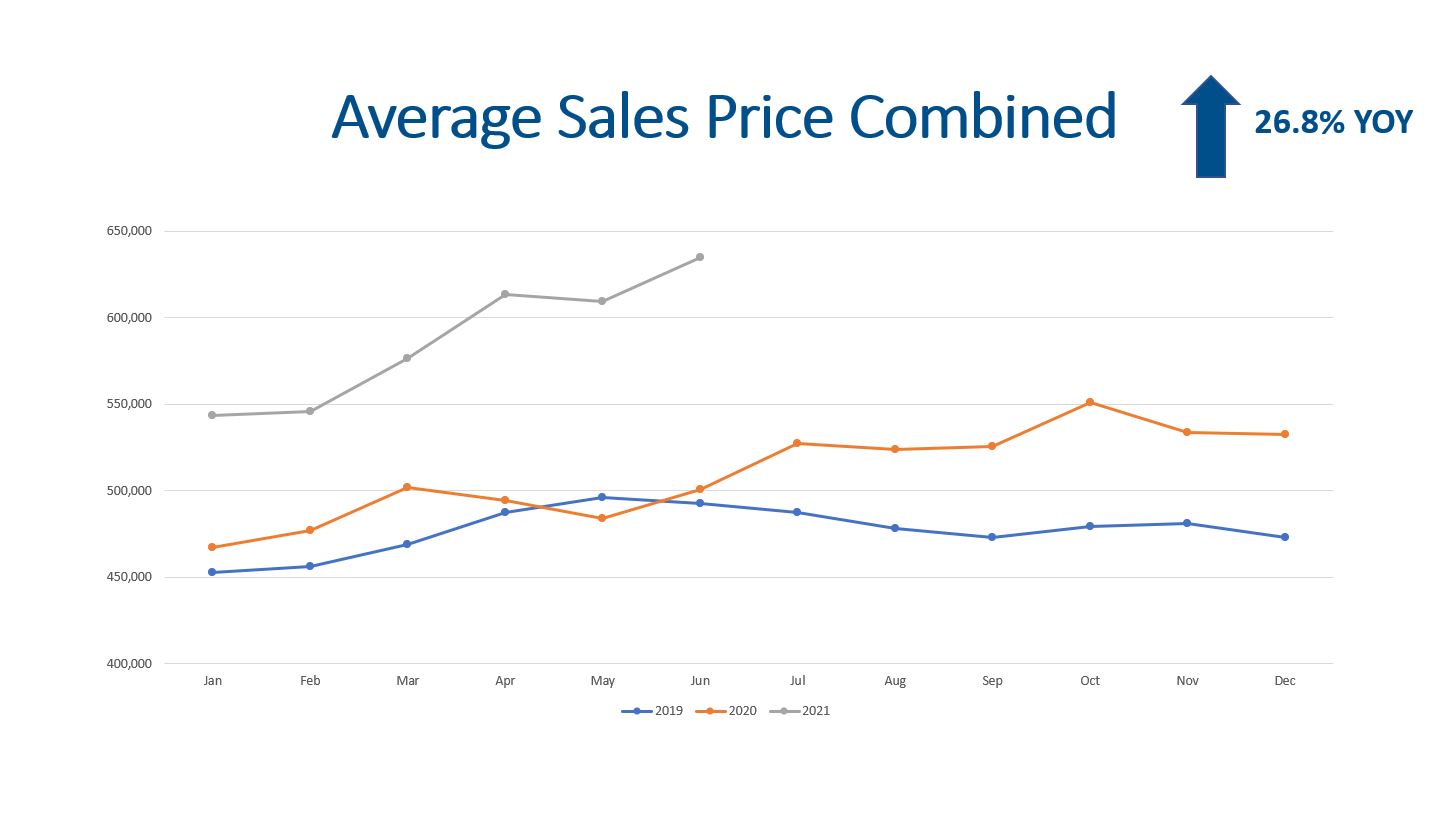
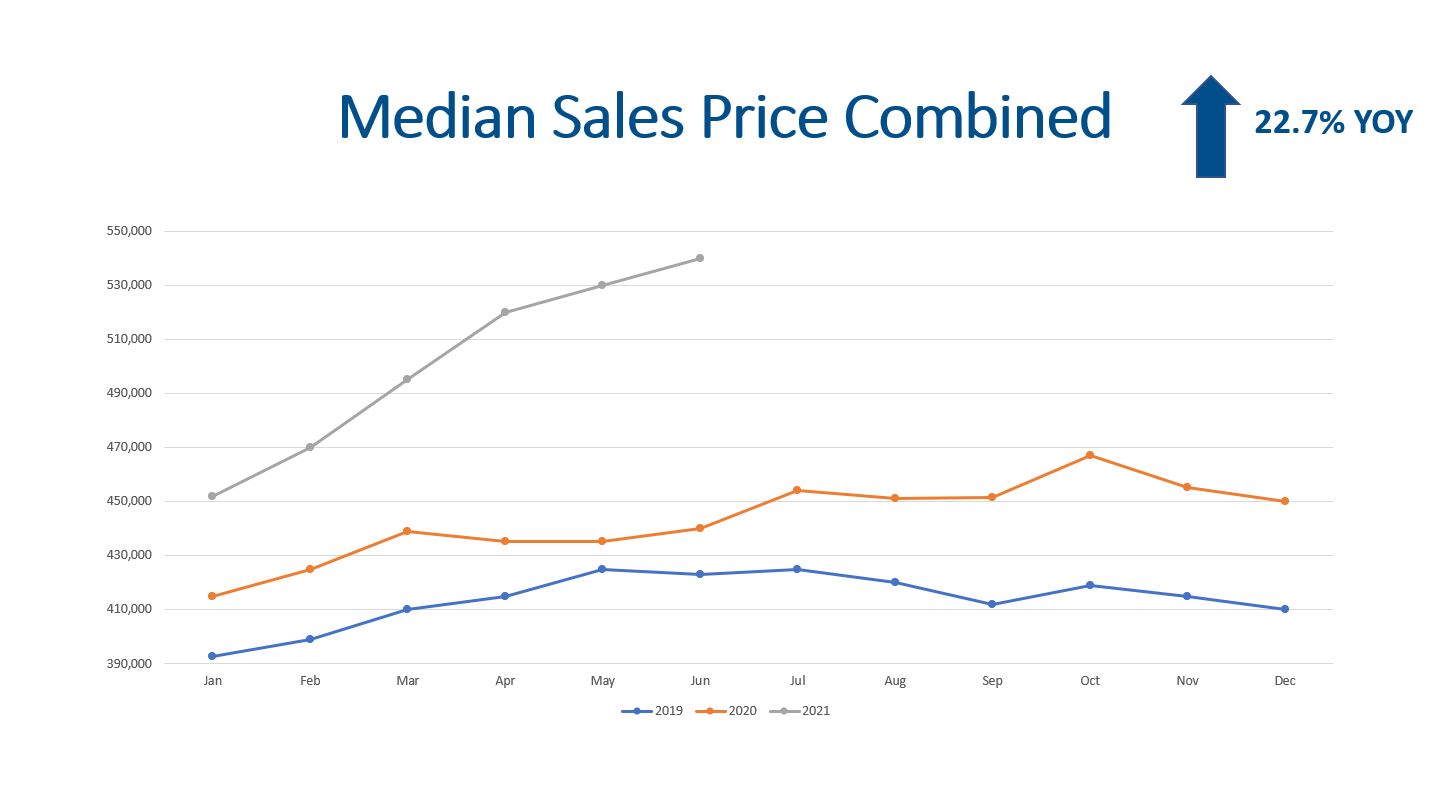
Prices are still rising! June saw another increase in the average sales price. The average for the entire market including single family detached, condos, and town homes increased 26.8% YOY to $635,107. In June of 2020, the average price was $500,878.
The median sales price has similar trends but different numbers. The median sales price was $540,000 compared to $440,000 in June of 2020.
Last month I was comparing our market to San Diego and Los Angeles, but I was comparing our average price to their median price. Shame on me! The median sales price in LA is $725,000, so the Denver Metro market has a lot more room to run before we become LA. A 10% down payment in LA would be $72,500 and the principal and interest payment would be $2,747 before taxes and insurance. A 10% down payment in Denver would be $54,000 and the principal and interest payment would be $2,046. Wow!!! The monthly payment is $701 less before we even consider taxes and insurance! Do you see why Denver is so attractive?!?!
Months of Inventory
Months of inventory is a great indicator to determine where we are at in the market cycle. A seller’s market has 0-3 months of inventory. A balanced market is 4-6 months of inventory, and 7+ months of inventory is a buyer’s market (this is where prices decline).
Recolorado’s data shows we had 1 month of inventory. If we do the math, there were 3,982 listings and 6,266 closings, we have 2.7 weeks of inventory. This means if no new homes come on the market, we will have zero homes for sale within 2.7 weeks!
Final Thoughts
All in all, supply, demand, prices, and months of inventory are all market indicators. Total showings have returned to normal and more new listings hit the market providing a little relief for buyers but not much. Record low inventory is still limiting buyer options. As prices continue to climb more and more sellers will jump into the market. Demand continues to be strong as buyers are looking to get into real estate. The months of inventory indicate we are still in a seller’s market! We believe more appreciation is instore for homeowners in 2021.
Here is the full presentation:
