There are some mixed signs coming from the residential real estate market! On one hand, new listings, pending contracts, and closings all improved in February compared to January. On the other hand, total listings, pending contracts, closings, and interest rates all worse than a year go. Mortgage interest rates started February at 6.09% but increased to 6.55% by the end of the month. Let’s dive into the key market data for the Denver residential real estate market to see what is happening with supply, demand, sales prices, and months of Inventory for February 2023.
Supply
In February we had 3,709 new listings hit the market. This is down (14.1%) from February 2022 but is up 15.1% from January 2023. This indicates more sellers are willing to list.

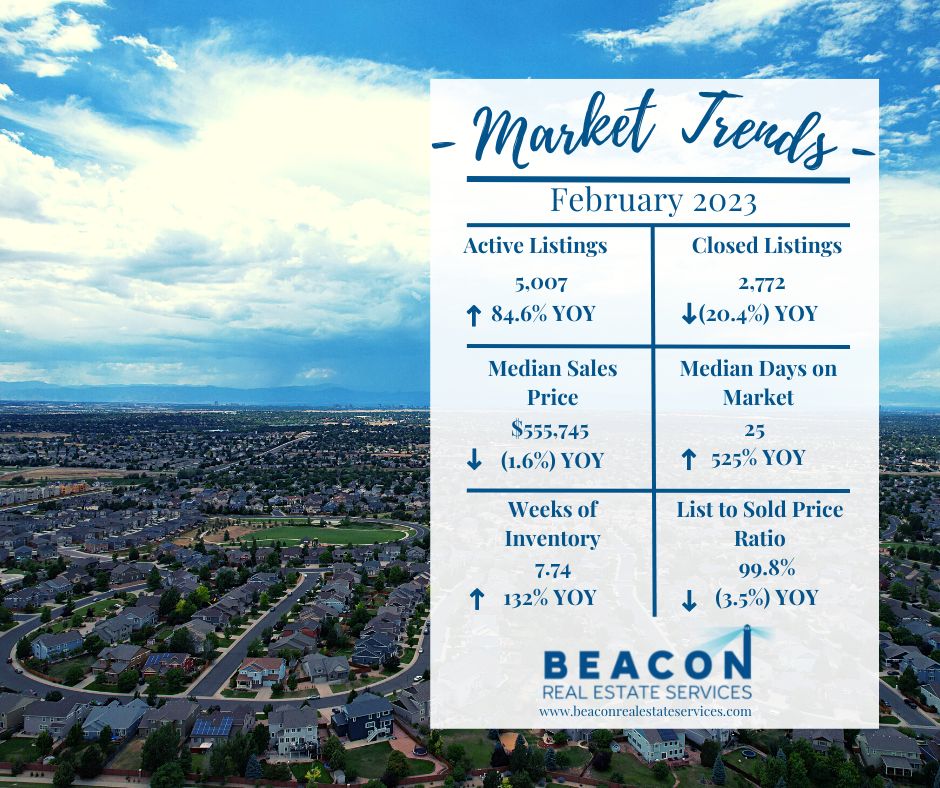
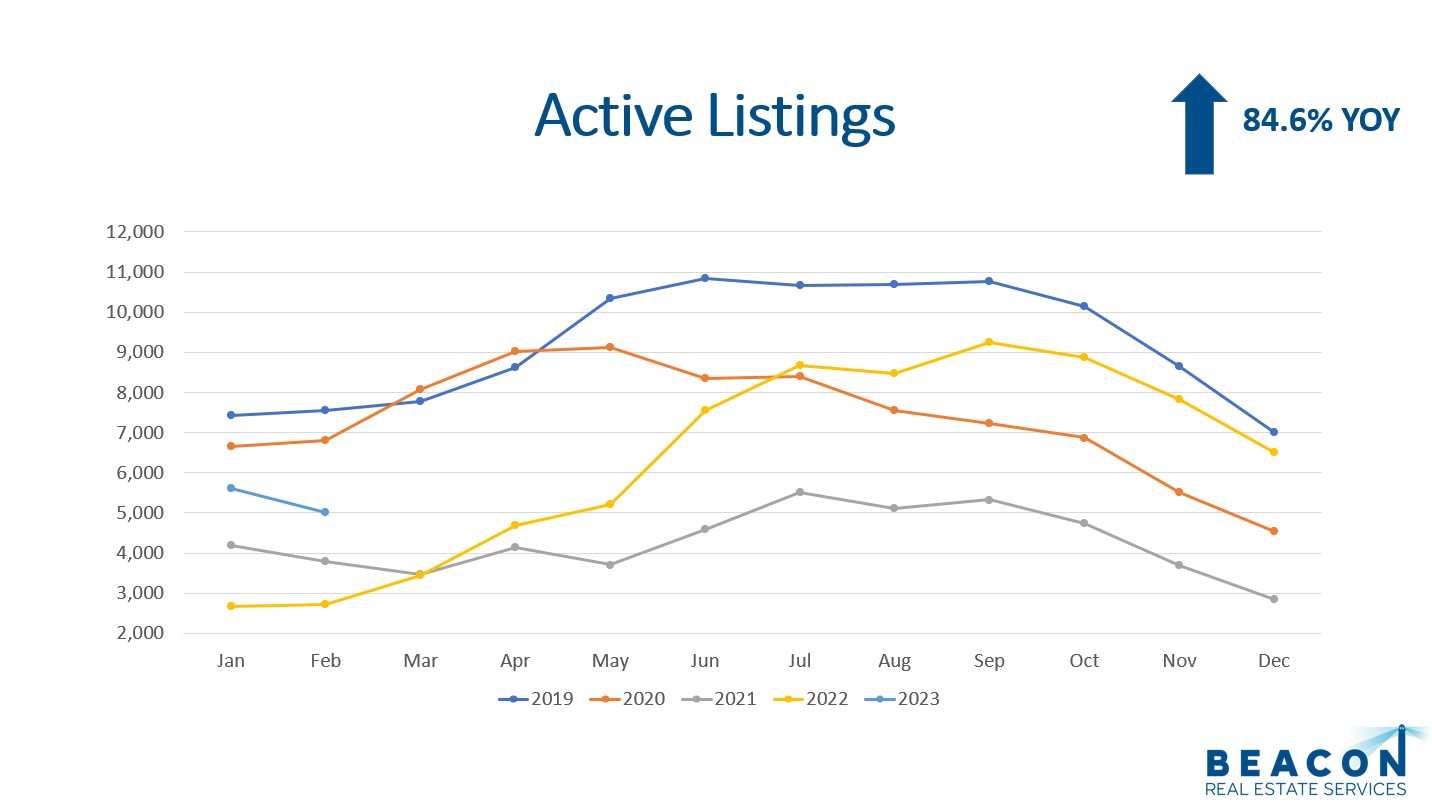
The total amount of active listings at the end of the month came in at 5,007. This is up 84.6% from February 2022 but is down (10.9%) from January 2023. The 10-year February average from 2013 to 2022 is 6,321 listings, so we are below our long-term average.
The most recent report for detached home construction starts is January 2023. The Dener Metropolitan Statistical Area (MSA) pulled permits on 567 homes. This is up from 475 in December, but is down (45.2%) compared to January of 2022. The cost of materials, labor, and loans will need to come down before new construction picks up.
All in all, the supply is up from the 2021 and 2022 but is less than 2019 and 2020. Let’s look at demand.
Demand
Showings are a great leading indicator for the residential real estate market. There were 52,990 showings booked through the largest showing service in the Denver metro area. This is down (47.1%) compared to February 2022. The average amount of showings in February, for the prior four years, was 92,548.
Denver had 3,492 properties go under contract in February 2023. This is a (10.7%) decrease compared to February 2022 but is a 15.2% increase compared to January 2023. It looks like late winter thaw, which is great!
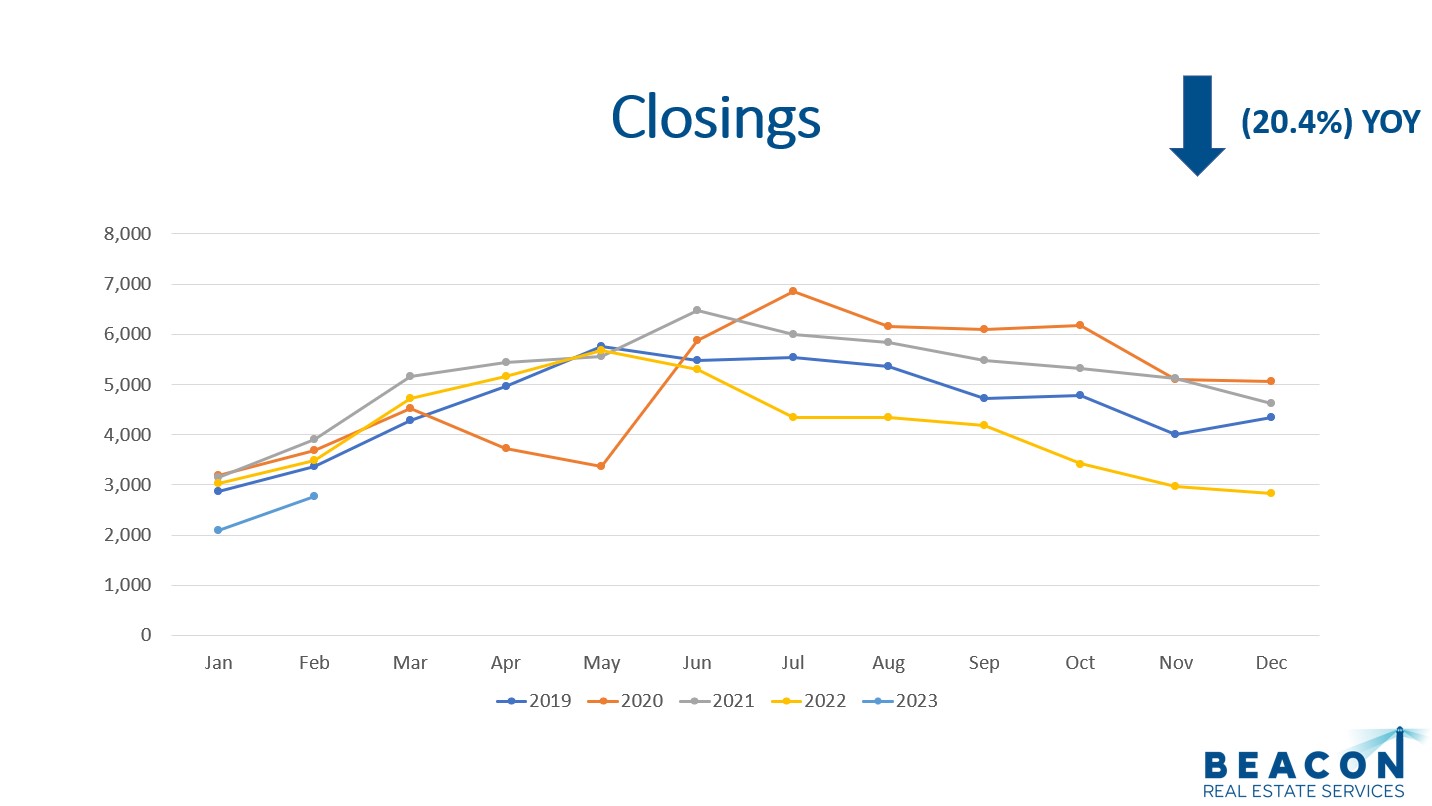
There were 2,772 closings in February 2023 compared to 2,098 in January 2023. This is a 32.1% increase month over month! A year ago, we had 3,484 closings in February so the volume of closings represents a (20.4%) decrease YOY.

The median days on market for February 2023 was 25 days. This means half of the properties listed are sold in less than a month and the other half took longer. The average marketing time was 47 days as more properties take longer to sell.
All in all, demand for housing is still out there but the market conditions are clearly different from a year ago. Mortgage rates are increasing again which will likely have an impact on demand compared to last year. Let’s look at sales prices.
Sales Prices
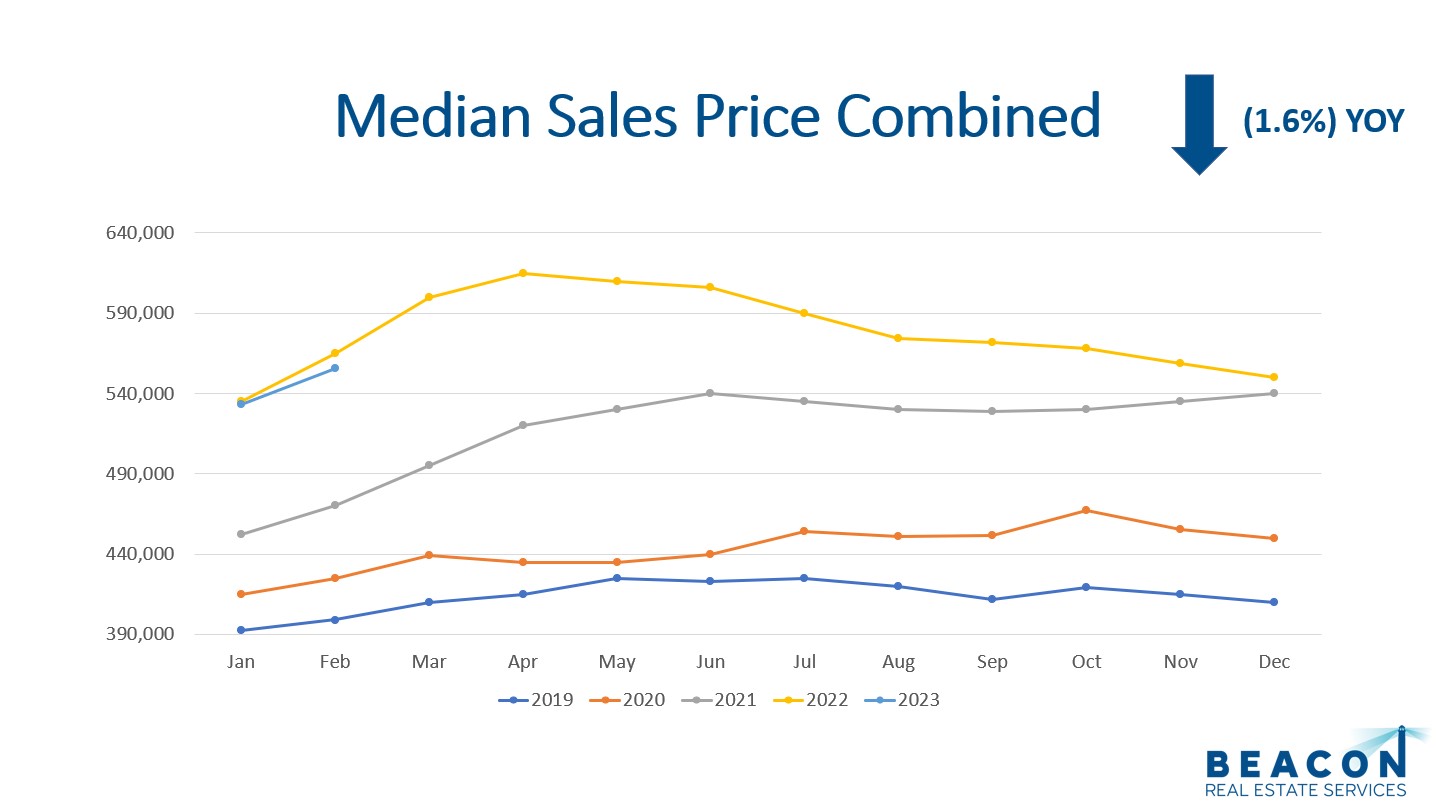
The median sales price for February was $555,745. This metric includes detached and attached. This metric shows a (1.6%) decrease compared to February 2022 but is up 4.3% when compared to January 2023. The median sales price is down (9.6%) compared to April 2022.

The long-term average appreciation for residential real estate is 6%. We expect some downward pressure on prices during 2023 due to the higher interest rates.
In summary, prices are down from last year, but we are encouraged to see an uptick after nine months of steady decline. Let’s remember, real estate is a long-term investment and timing any market is next to impossible. The best we can do is look at the data! Let’s look at months of inventory now.
Months of Inventory
The months of inventory is a great indicator to watch for market trends. Typically, a seller’s market has 0-3 months of inventory. A balanced market has 4-6 months of inventory, and 7+ months of inventory is a buyer’s market. In a seller’s market prices go up. In a buyer’s market prices go down.
With 5,007 listings on the market and 2,772 closings, we have 1.8 months of inventory or 7.74 weeks of inventory. Therefore, the inventory is low when compared to the demand.
All in all, months of inventory is a great metric to watch.
Final Thoughts
In conclusion, supply, demand, median sales price, and months of inventory are ideal key performance indicators to watch for market trends. Supply is up from the record lows of 2021 and 2022 but is still lower than the long-term average. Demand etched higher in February compared to January but is still lower than the same time last year. With the 30-year mortgage interest rate increasing again, that could have an impact on demand and price increases. Lastly, 1.8 months of inventory is quite low.
Here is a link to the full presentation: