Fox31, 9News, and others have reported on the Denver Housing Market in the last month. What is really going on? The answer is multi-faceted. First, the real estate market is seasonal. Every year more homes sell in late Spring and early Summer compared to late Fall and Winter. Second, buyers were hammered with an abnormally competitive selling season that started earlier than normal, and they had fewer options than previous years with really low inventory. Lastly, with restrictions lifted many people planned vacations and started traveling. Let’s look at the trends in Supply, Demand, Sales Price, and Months of Inventory for July 2021.
Supply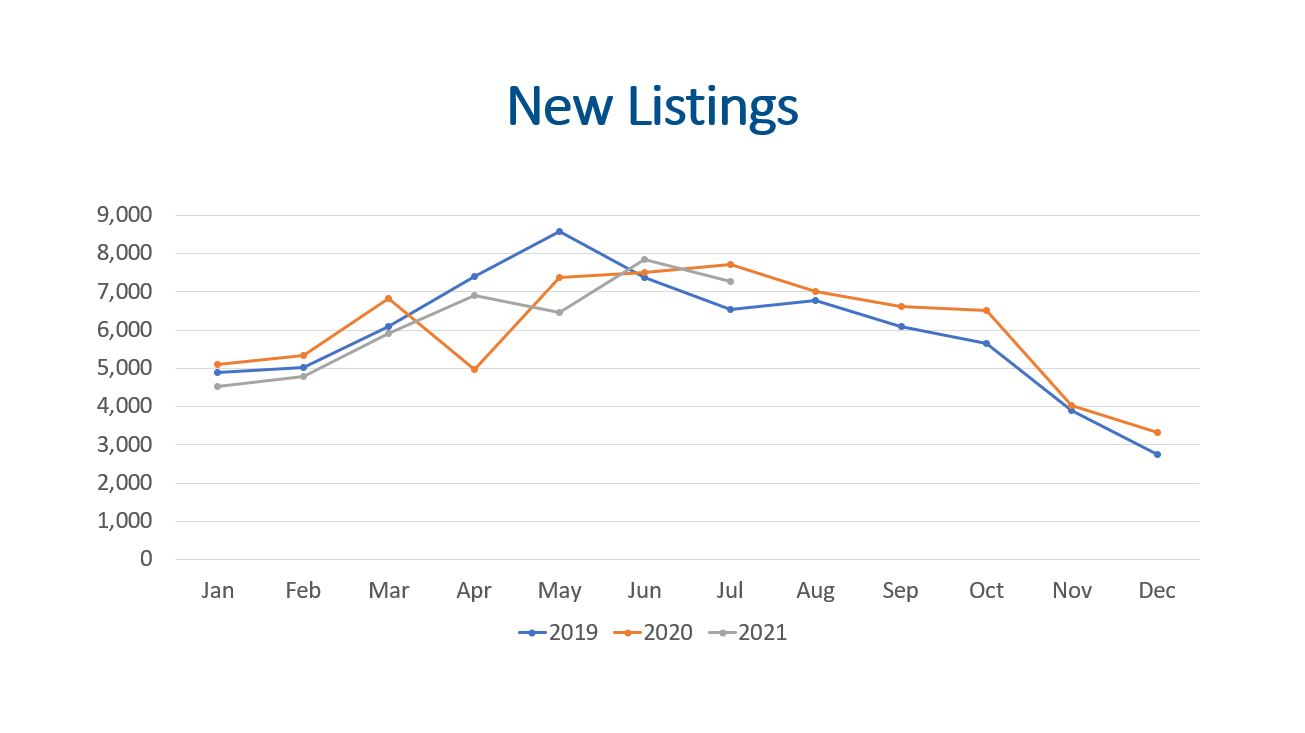 New listings dipped (7.4%) compared to June 2021, and total new listings are down (6%) compared to the same time last year. Last year was such a weird year it is good to also look at July 2019, and we were actually up 11% from then.
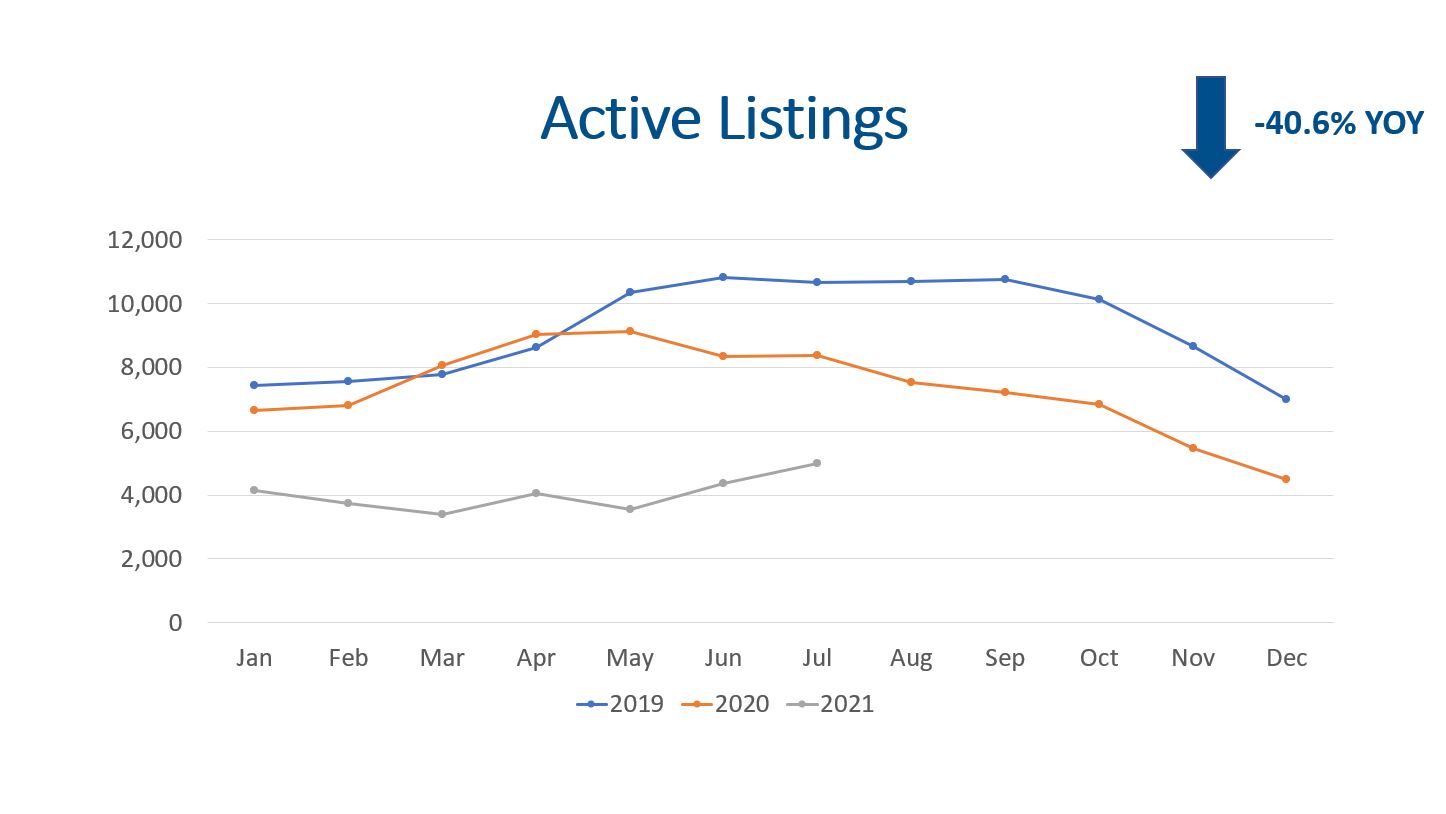
The total number of active listings at the end of the month was still quite low with 4,978 listings. This represents a (40.6%) decrease from July 2020 and a (54%) decrease from July 2019. The graph really tells the story of stubbornly low inventory that is a fraction of what it should be. Hopefully the trend of more properties for sale will continue.
As more homes come on the market and buyers have more options, so we will likely see the rate of appreciation decelerate from ludicrous speed to more of the historical appreciation rates of 6-10%.
Demand
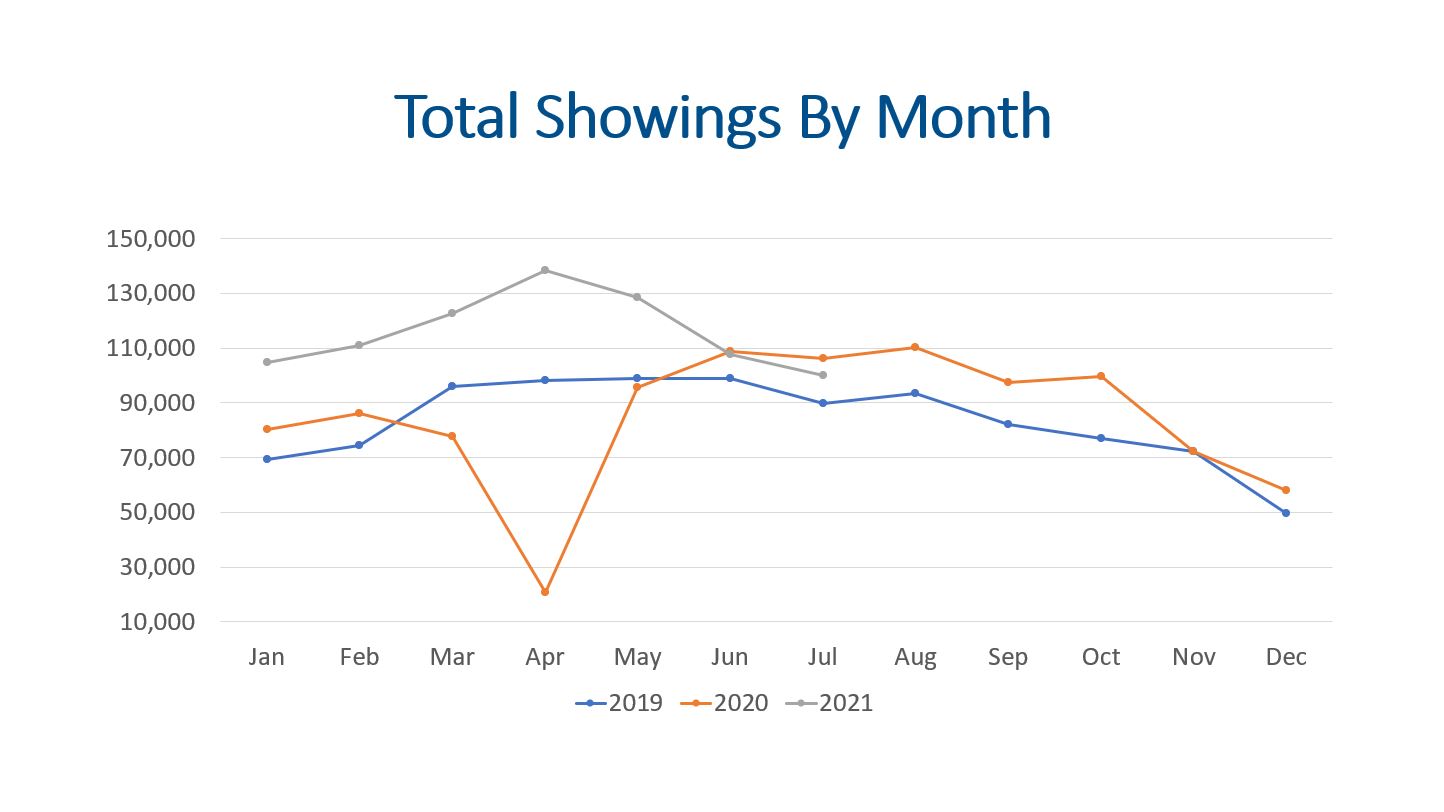
Showings are the leading indicator for the real estate market. Several news outlets and agents have been talking about a decrease in showings. Yes, it is true that total showings and showings per active listing are down, but we need to look at the data and think about what is happening.
Total YTD showings are 813,781. During the same period in 2020, there were 576,065 showings. This means total showing volume this year is 41.3% higher than last year. Total showings have continued to decline from the record-breaking showing activity that ran from January to May this year. Even so, there were 100,168 showings in July. Although this is down (5.7%) compared to July last year it is up 12% from July 2019.
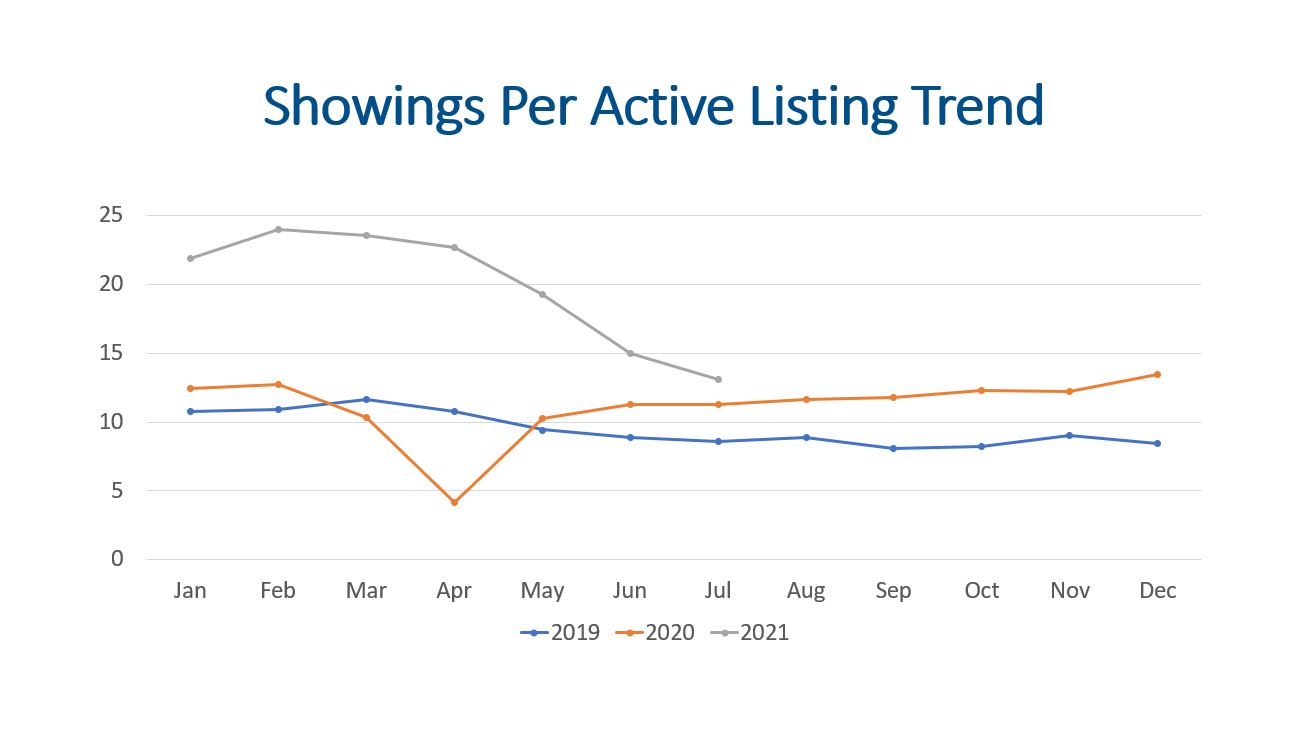
July saw 13 showings per active listing. Although this is a lot less than the 24 showings per active listing in February it is still higher than the 11 showings per active listing seen in July of 2020.
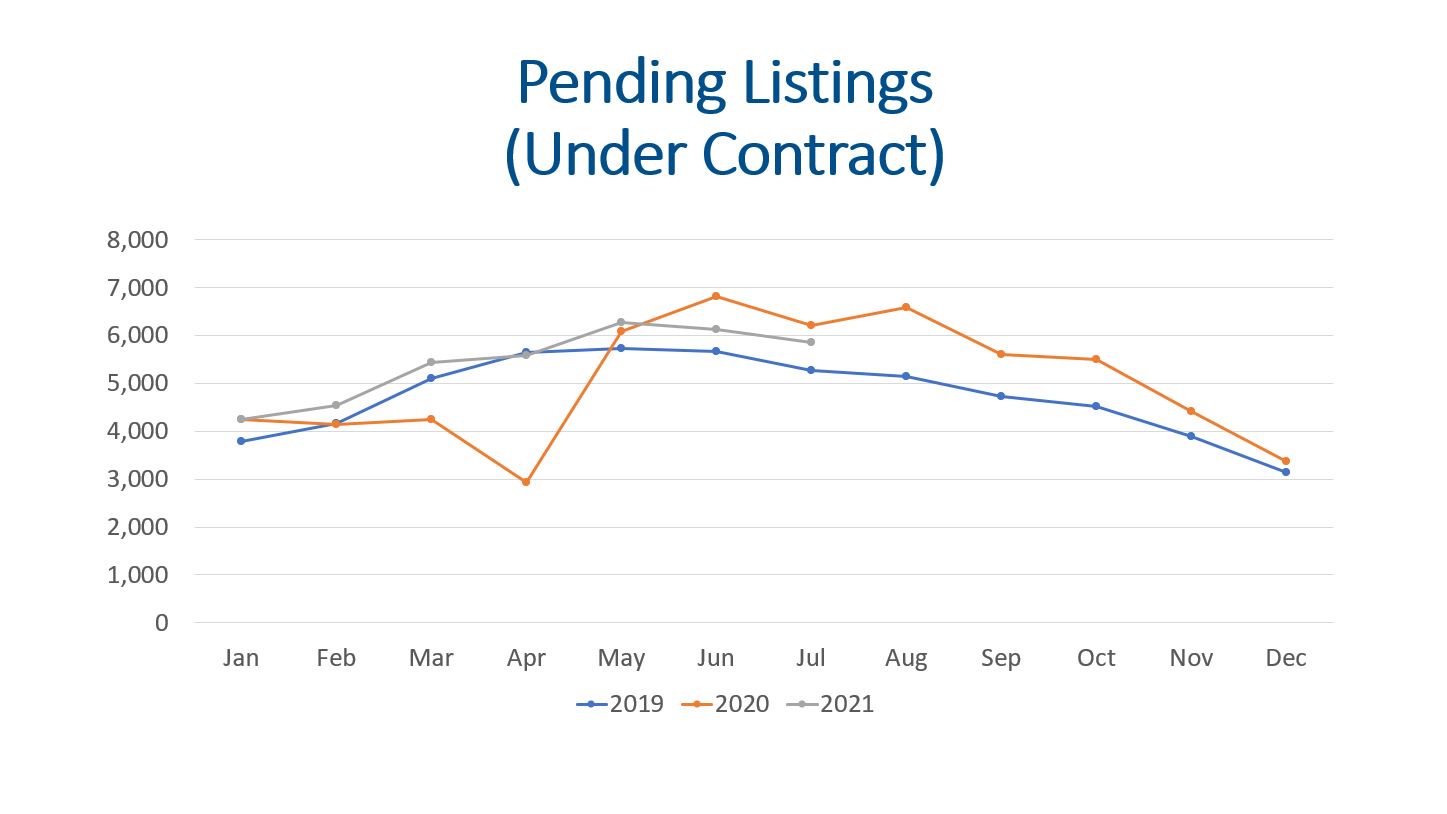
There were 5,846 properties that went under contract in July 2021. The trendline for properties going under contract in 2021 is following 2019 but a little higher volume.
There were 5,851 closings during July. This volume is lower than July 2020 by (14.6%) but that isn’t a great metric because a lot of Spring sales became Summer sales with the pandemic. Again, the trendline is following 2019 but a little higher in total volume.
The median days on market has been hovering at 4 days since March, so buyers are ready to make a quick decision if they like the property.
Overall, these indicates show a decline in showings per active listing, but we still have a lot of properties going under contract and closing.
Median Sales Price
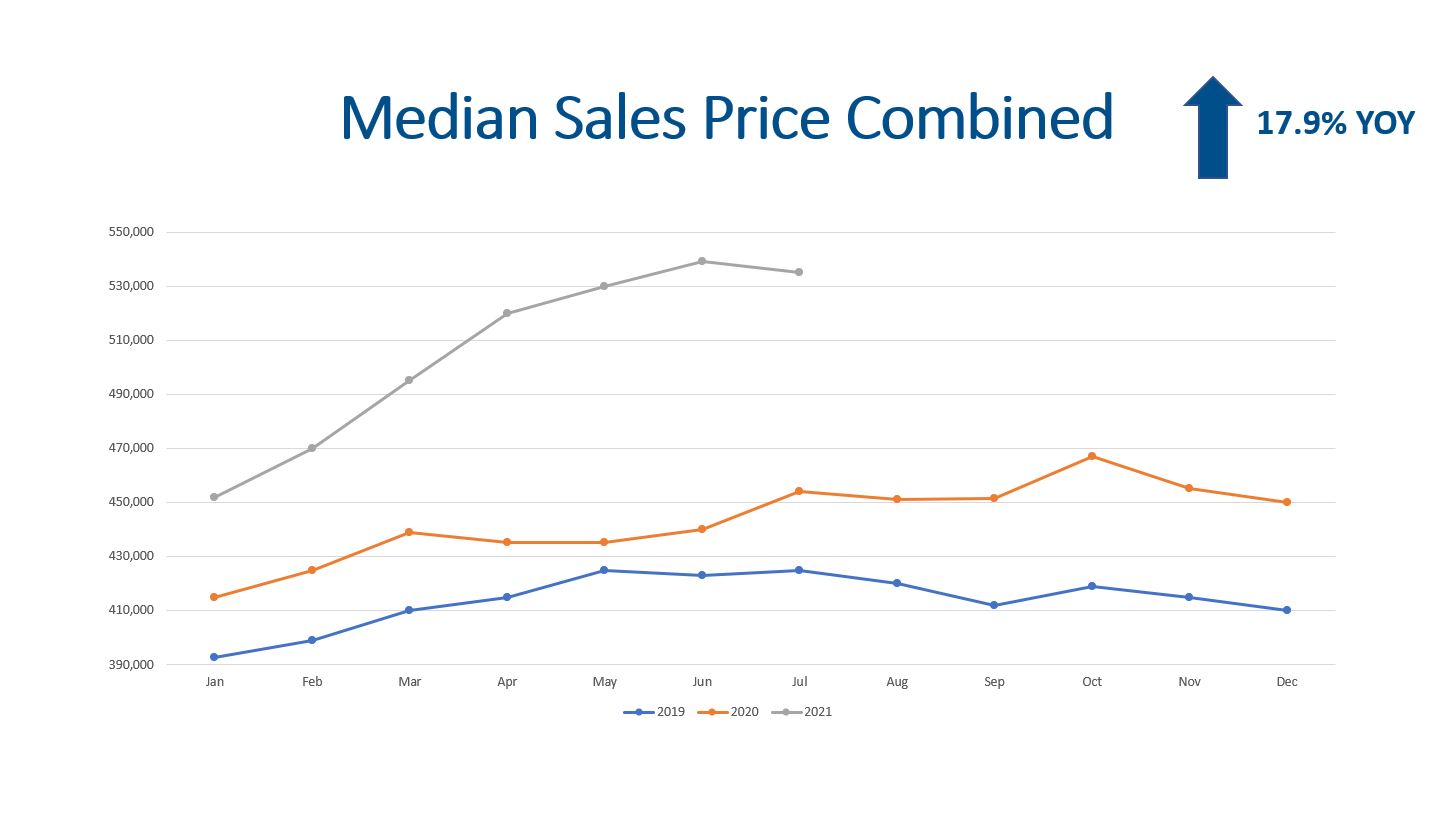
The median sales price for July was $535,000. This represents a slight dip of 80 basis points compared to June of 2021, but we are still 17.9% higher than July of 2020.
Prices have been increasing because the supply has been much lower than normal and demand has been a little strong than previous years. This is great for everyone who owns real estate but it has been challenging for first time homebuyers.
Months of Inventory
Months of inventory is a great indicator to determine where we are at in the market cycle. A seller’s market has 0-3 months of inventory. A balanced market is 4-6 months of inventory, and 7+ months of inventory is a buyer’s market (this is where prices decline).
With 4,978 listings on the market and 5,851 closings, we have 3.6 weeks of inventory. This is basically an additional week compared to the 2.7 weeks of inventory that we had last month. This is still low inventory.
Final Thoughts
All in all, the seasonality of real estate, frustrated buyers from the Spring, and the lifting of covid restrictions have all contributed to a softening in the market. Supply, demand, prices, and months of inventory are all market indicators worth watching. Total showings have returned to more of a normal level from the record-breaking levels seen earlier in the year. More new listings coming to market means that buyers are starting to get some relief, and they have a few more options. A lot of sellers have been reluctant to sell this year for fear of not finding a replacement home. Demand continues to be strong but it is different from earlier this year. The increase of one week of inventory is helpful for buyers but isn’t really that much. We believe home value appreciation will moderate some for the rest of the year.
Here is a link to the full presentation:
