It is hard to believe that 2021 is nearly done! The residential real estate market has seen some significant changes with low inventory, low interest rates, high level showings per active listing, and large appreciation.
Here are the latest market trends for the residential real estate in Denver. Let’s look at the trends in Supply, Demand, Sales Prices, and Months of Inventory for November 2021.
Supply
New listings were basically even with November of last year. Although there was a (26.6%) decline in new listings compared to October, this is a seasonal change that was expected. Fewer people list their homes during the holidays.
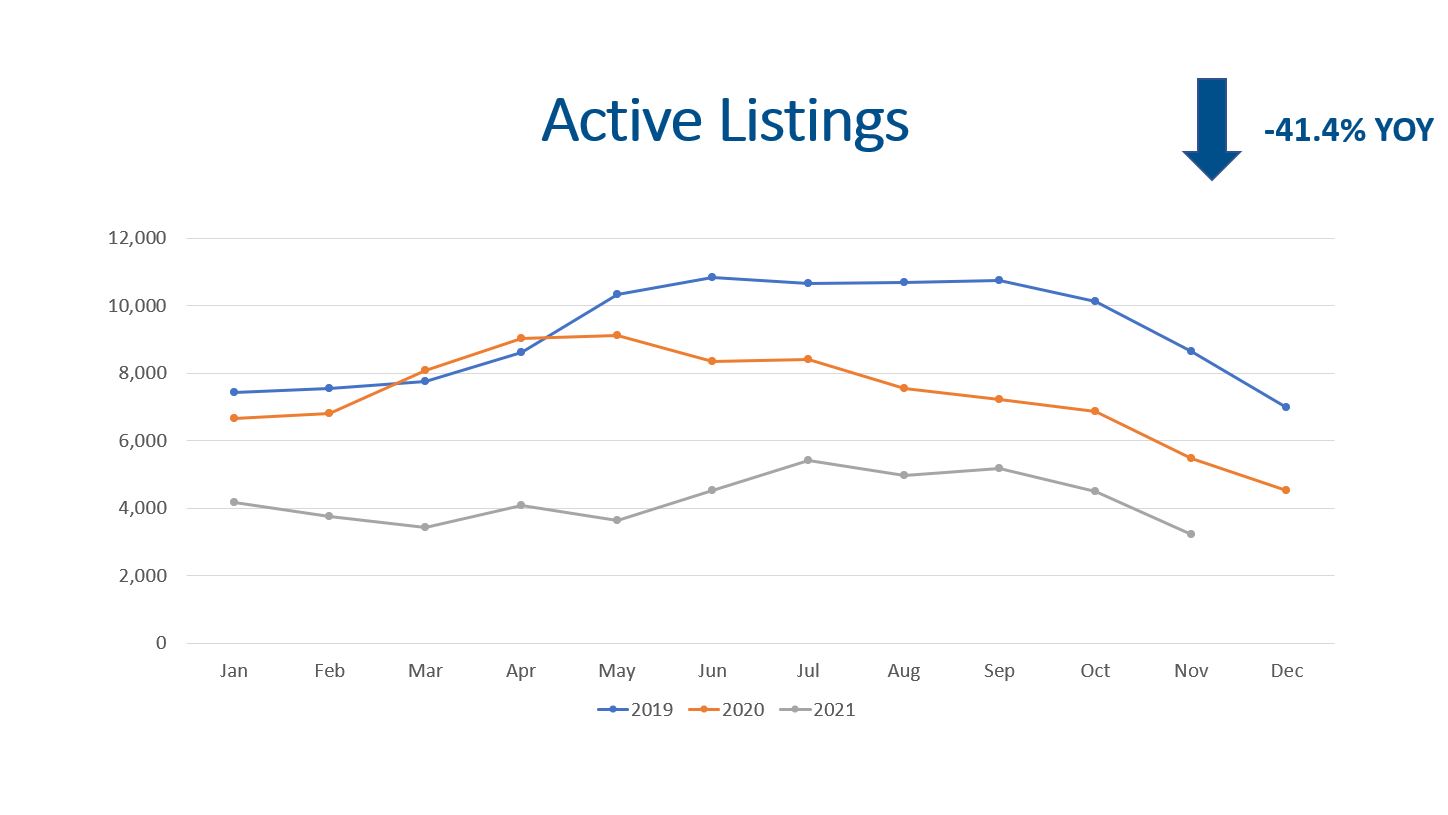
The Denver Metro market ended November 2021 with just 3,213 homes on the market! This is (41.4%) less than November 2020 and (62.9%) less when compared to November 2019. What does this mean? It means that November was yet another month where buyers experienced fewer options when buying a home.
The inventory issue is one reason why more buyers opted for a new home instead of a resale home. Detached single family construction starts are up 15.6% YTD.
For what it is worth, we had 15,531 homes on the market in November of 2012. I remember that market as we started to see home appreciation for the first time in five years!
All in all, the amount of supply for residential homes for sale is much lower than it should be. As long as inventory stays low and demand remains strong, buyers will have fewer options to choose from.
Demand

Total showings for November were right in line with 2020 and 2019 at 72,476. Yes, there was a decrease of 24,879 showings (25.5%) compared to October, but this statistic is irrelevant. Total showings are following the seasonal trend.
The volume of showings per active listing trend has been interesting to watch this year. November saw 13.5 showings per active listing. This trend has been higher than 2020 and 2019. Why is that? I am glad you asked! Total demand has increased nearly 2% while total listings, at any given moment, has decreased by (57%). This should have caused the showings per active listings to increase.
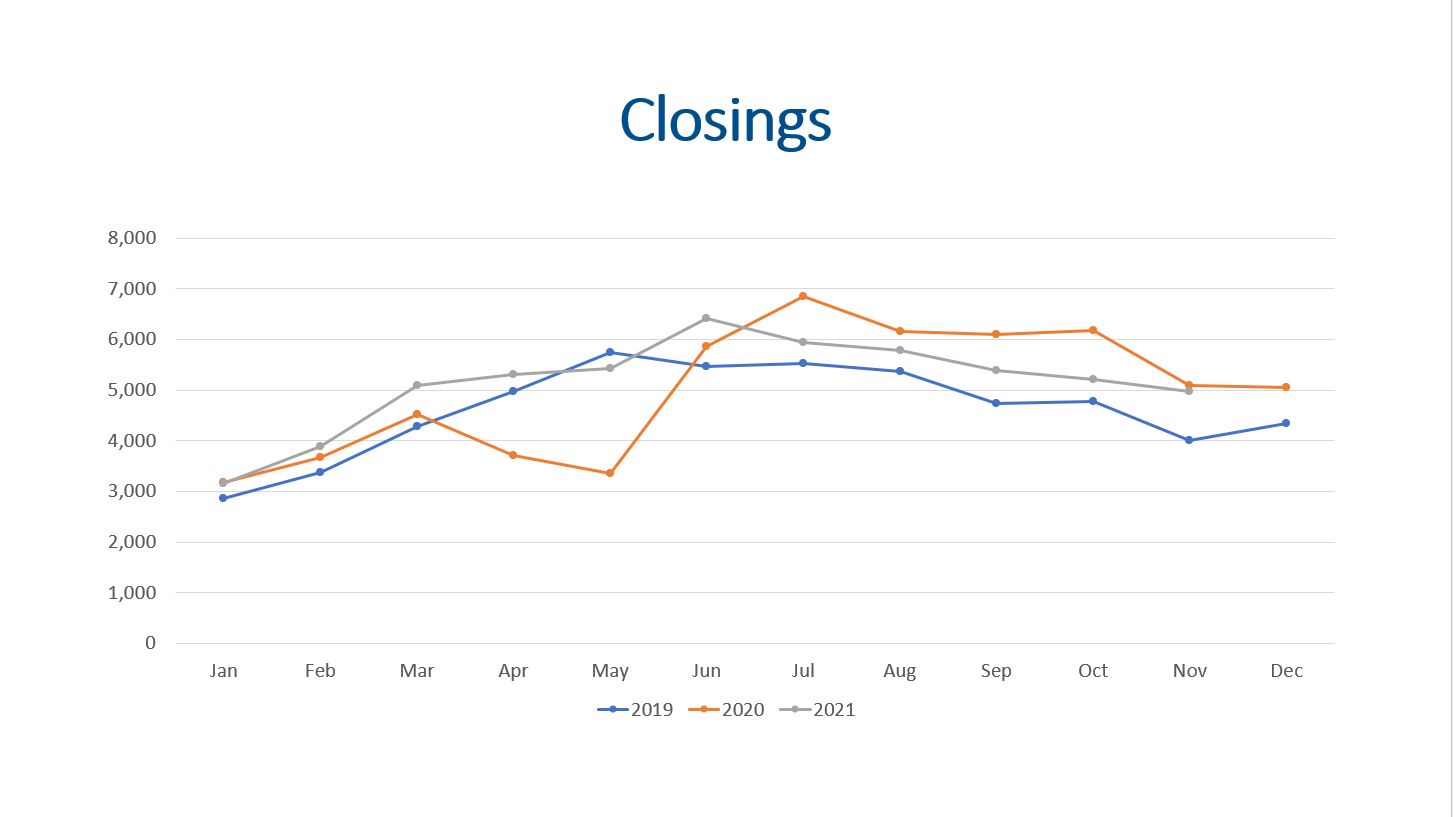
We saw 4,493 properties go under contract in November 2021, which is 85 more than November 2020. Also, we saw 4,969 closings during November. This is 122 fewer closings than November 2020.
The median days on market is still 5 days. Let’s pause for just a moment. Out of the 4,969 homes that closed last month, 2,485 homes sold with 5 days on the market or less! The average days on market was 18 days, so the remaining homes sold in more than five days bringing the average up 13 days from the median.
Total transaction volume is up 3.4% YTD compared to the same period in 2020.
All in all, showings, contracts, closings, and the median days on market all support that we are firmly in a seller’s market.
Sales Price

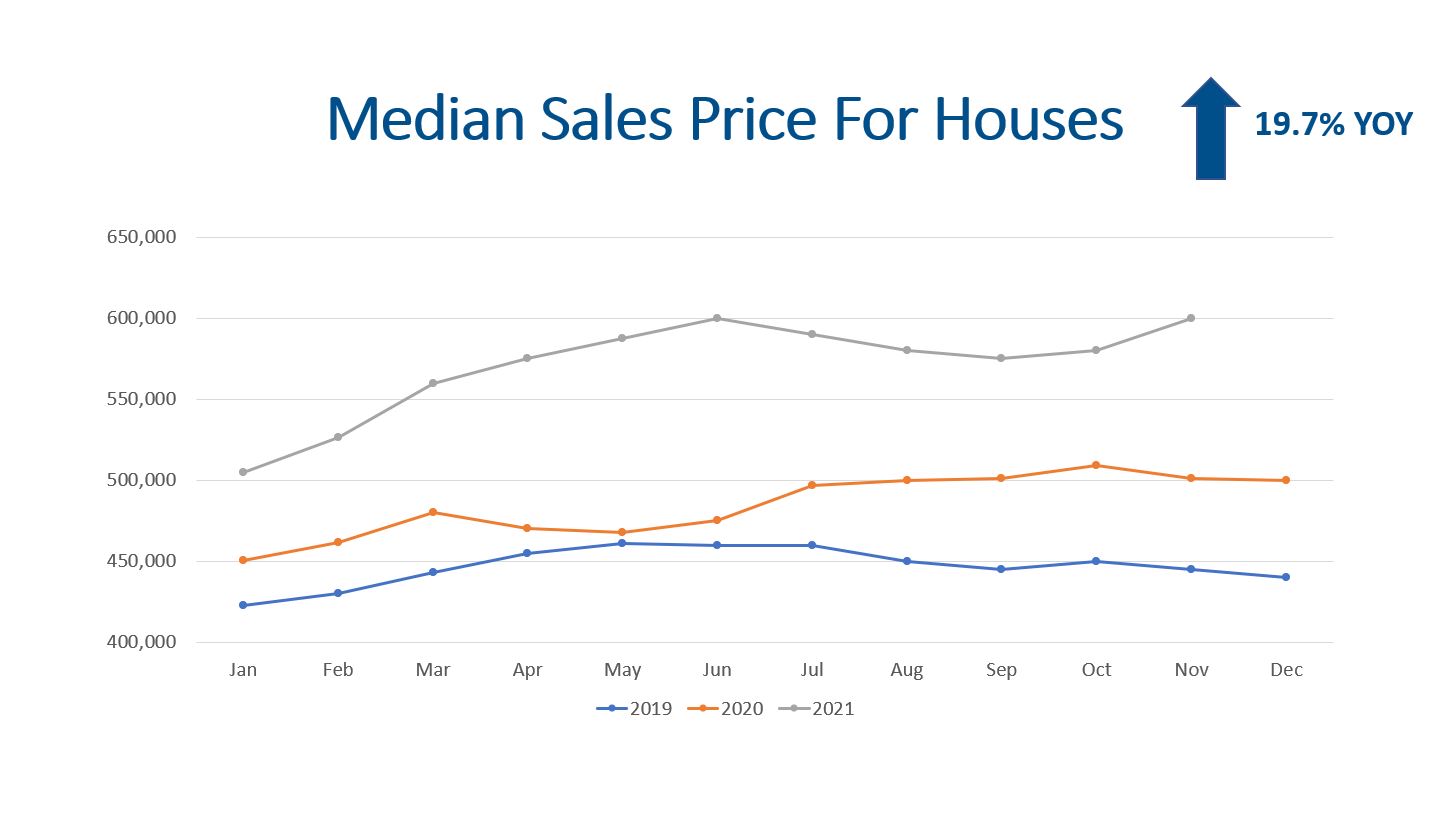
The average sales price for the market during November was $621,509. This is higher than the median due to high sales in the luxury market segment. When we focus on detached homes, the average is $700,220. Again, the $100k difference between the average home and median home is a function of the statistics.
Months of Inventory

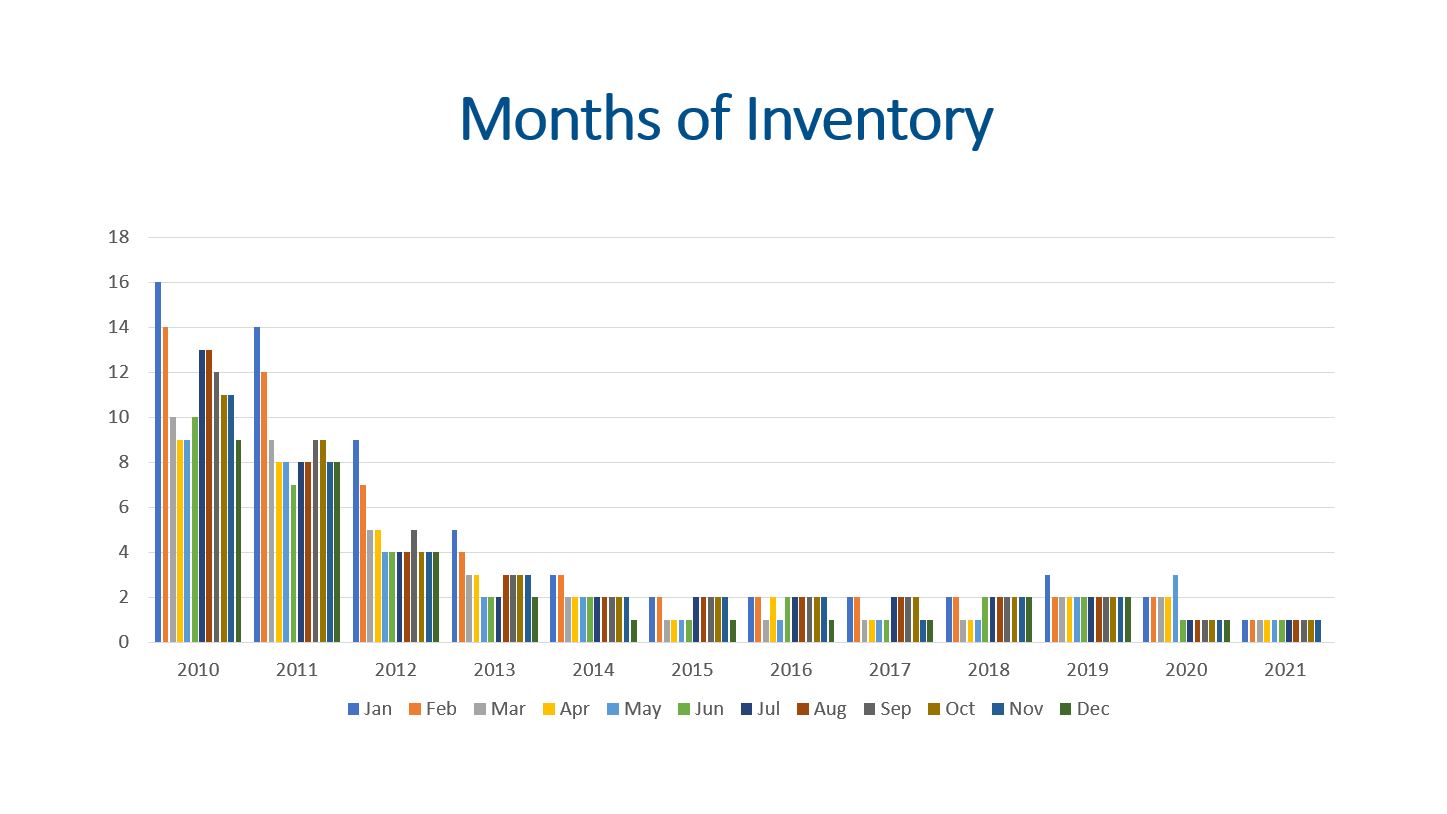
With 3,213 listings on the market and 4,969 closings, we have 2.7 weeks of inventory. Therefore, we are still in a seller’s market!
Final Thoughts
In conclusion, supply, demand, sales prices, and months of inventory are all worth monitoring. Supply has been stubbornly low all year. Demand has been strong with showings, contracts, and closings. Therefore, the median sales price has continued to rise. Lastly, with 2.7 weeks of inventory, home appreciation is likely to continue. The National Association of Realtors Economist survey is predicting home appreciation of 5.7%. I believe Denver will see a little better than that, but I don’t think 2022 will see another 19% increase. Time will tell!
Here is a link to the full presentation:
