
Thanksgiving is already next week! What are you thankful for this year? I am thankful for my family, friends, and all the opportunities to learn and grow.
What is going on in the Denver residential real estate market? I am glad you asked! Here are the latest market trends for the residential real estate. Let’s look at the trends in Supply, Demand, Sales Prices, and Months of Inventory for October 2021.
Supply
 New listings dipped (16.5%) compared to October of last year. Although this sounds like a lot, October of 2020 saw a record number of new listings. It is very typical for fewer homes to be listed during this time of year.
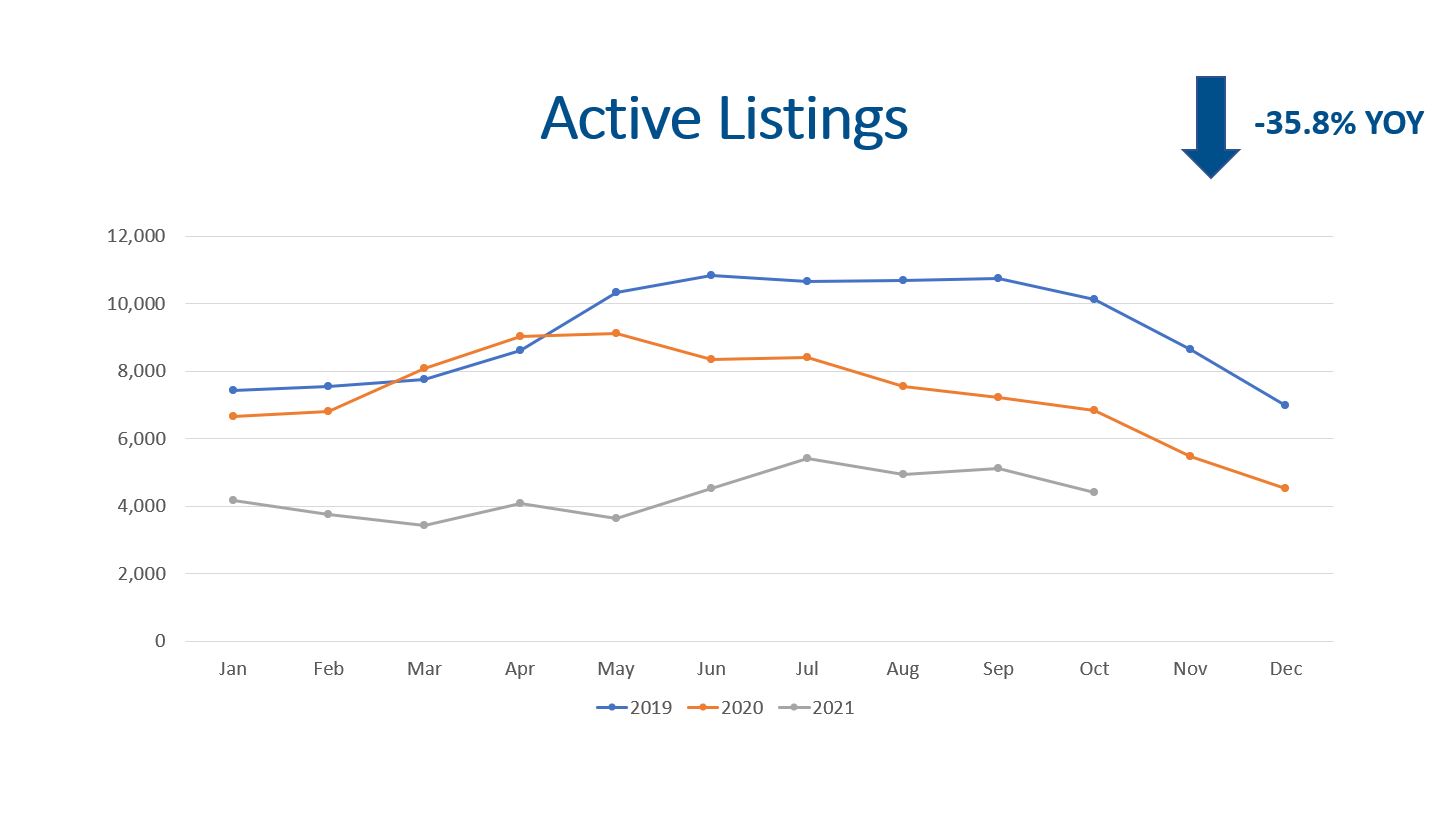
The Denver Metro market ended October 2021 with just 4,398 active listings on the market (pictured above)! This is (35.8%) less than October 2020 and (53.7%) less when compared to October 2019. This means buyers in the market have few options than they would have had in the past.
Ten years ago, we had 16,642 homes on the market, which was 3.8 times more listings that we do today. Wow! What a difference 10 years has made.
New construction is still booming! Year to date single family housing starts are up 19.1% compared to the same period in 2020.
All in all, residential homes for sale are much lower than they have been in the past so supply has been suppressed. As long as inventory stays low, buyers will persistently have fewer options to choose from.
Demand
 Total showings are the best leading indicator for the residential real estate market health. Total showings actually increased 9.8% in October compared to September 2021. However, we expect to see showings follow the typical seasonal declines in November and December.
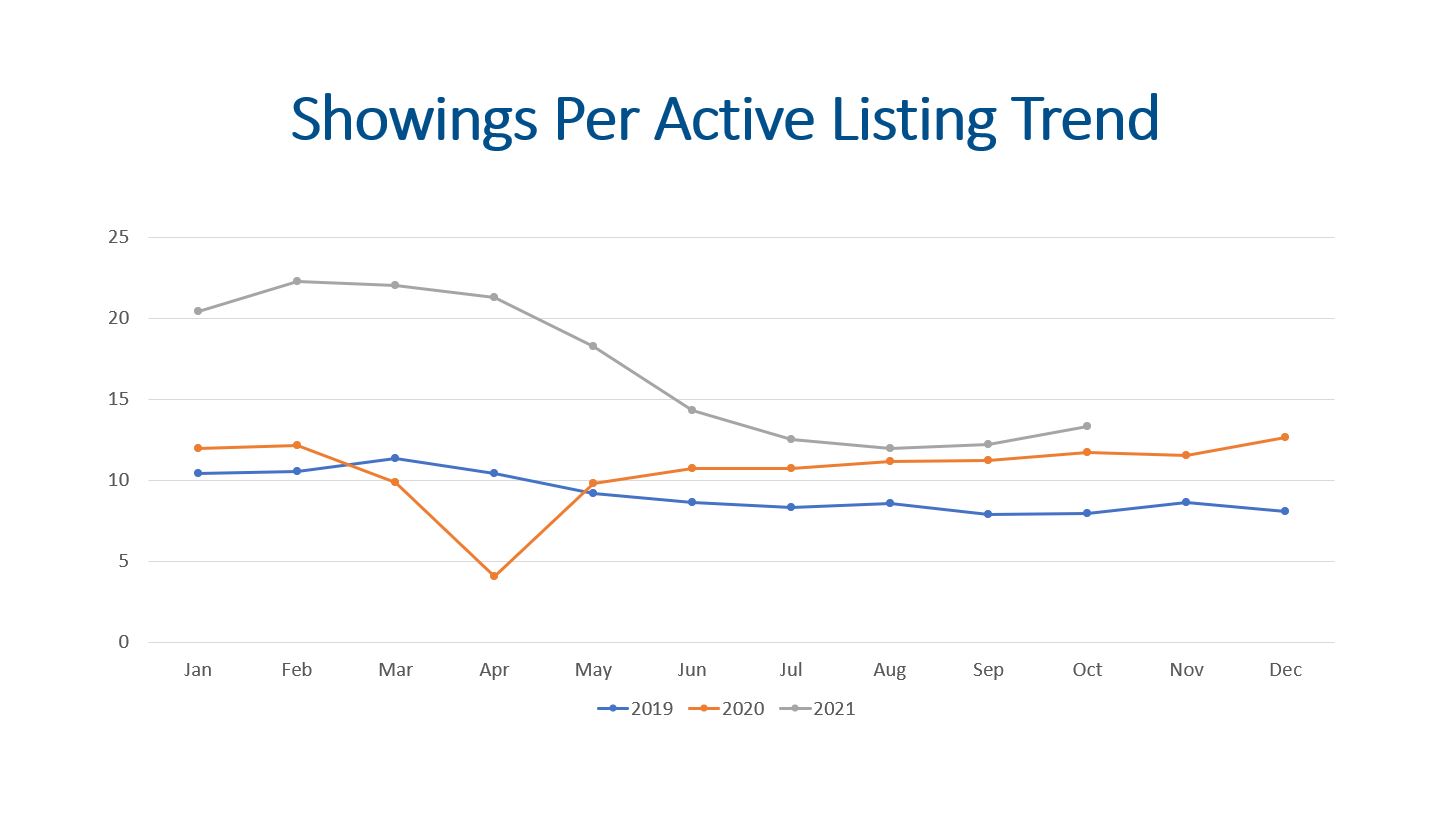
The total showings per active listing trend has been interesting to watch this year. October saw 13.3 showings per active listing which is higher than October 2020 and September 2021.
There were 5,461 properties that went under contract in October 2021, which is really close to the same volume last year and 6.1% higher than September 2021.
There were 5,182 residential real estate closings during October. This volume is lower than 2020 but is higher than 2019.
The median days on market is still 5 days, so the residential real estate market is moving fast with half of the properties selling in 5 days or less!
Total transaction volume is up 4% YTD compared to the same period in 2020.
All in all, showings, contracts, closings, and the median days on market all support that we are still in a seller’s market.
Median Sales Price
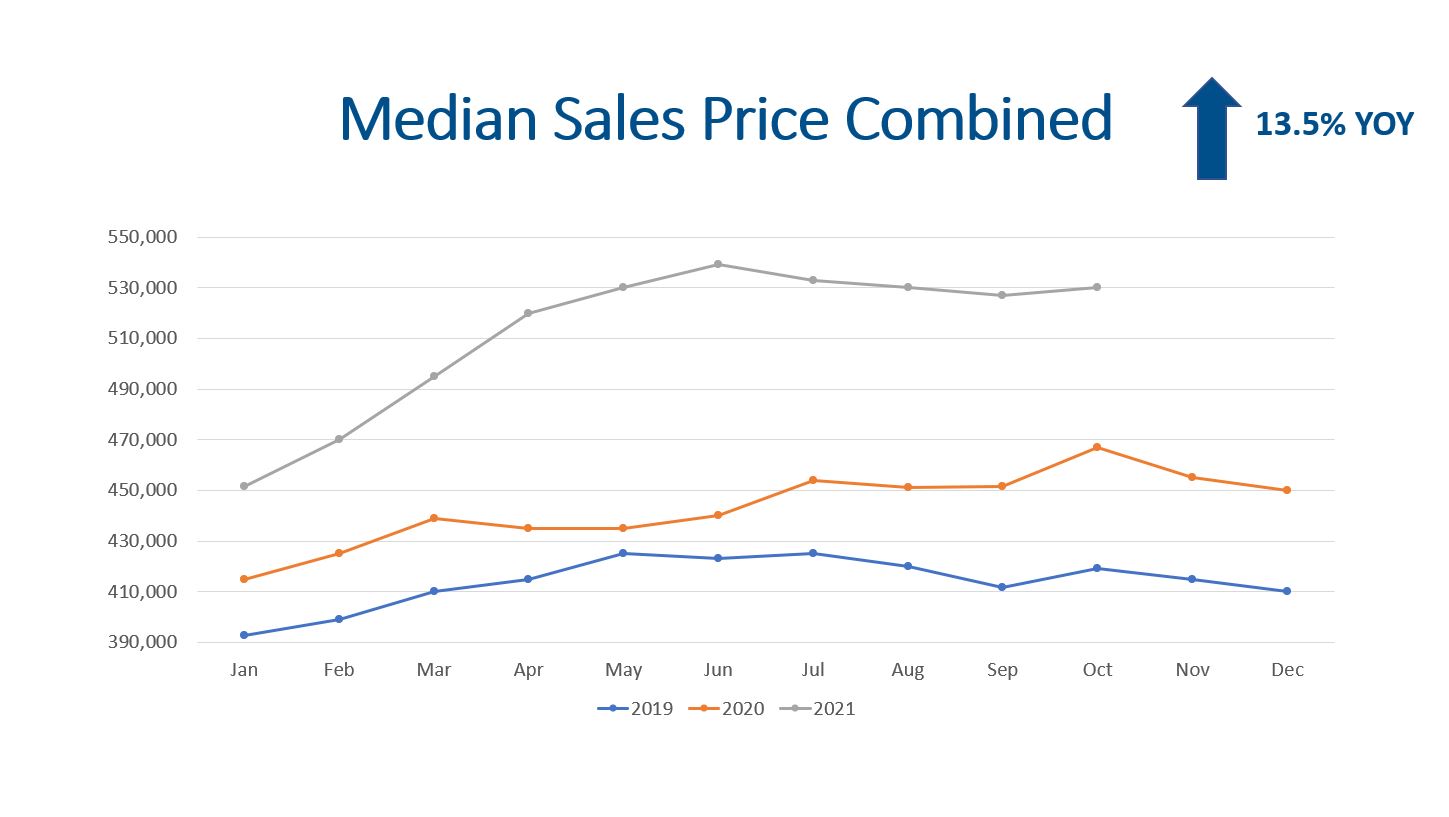 The median sales price for October was $530,000. This includes homes, condos, and town homes. If we look solely at detached homes, the median sales price is $580,000. This represents a 13.9% YOY increase! The median price of a condo and town home is at $330,000 which is 11.1% higher YOY.
Months of Inventory
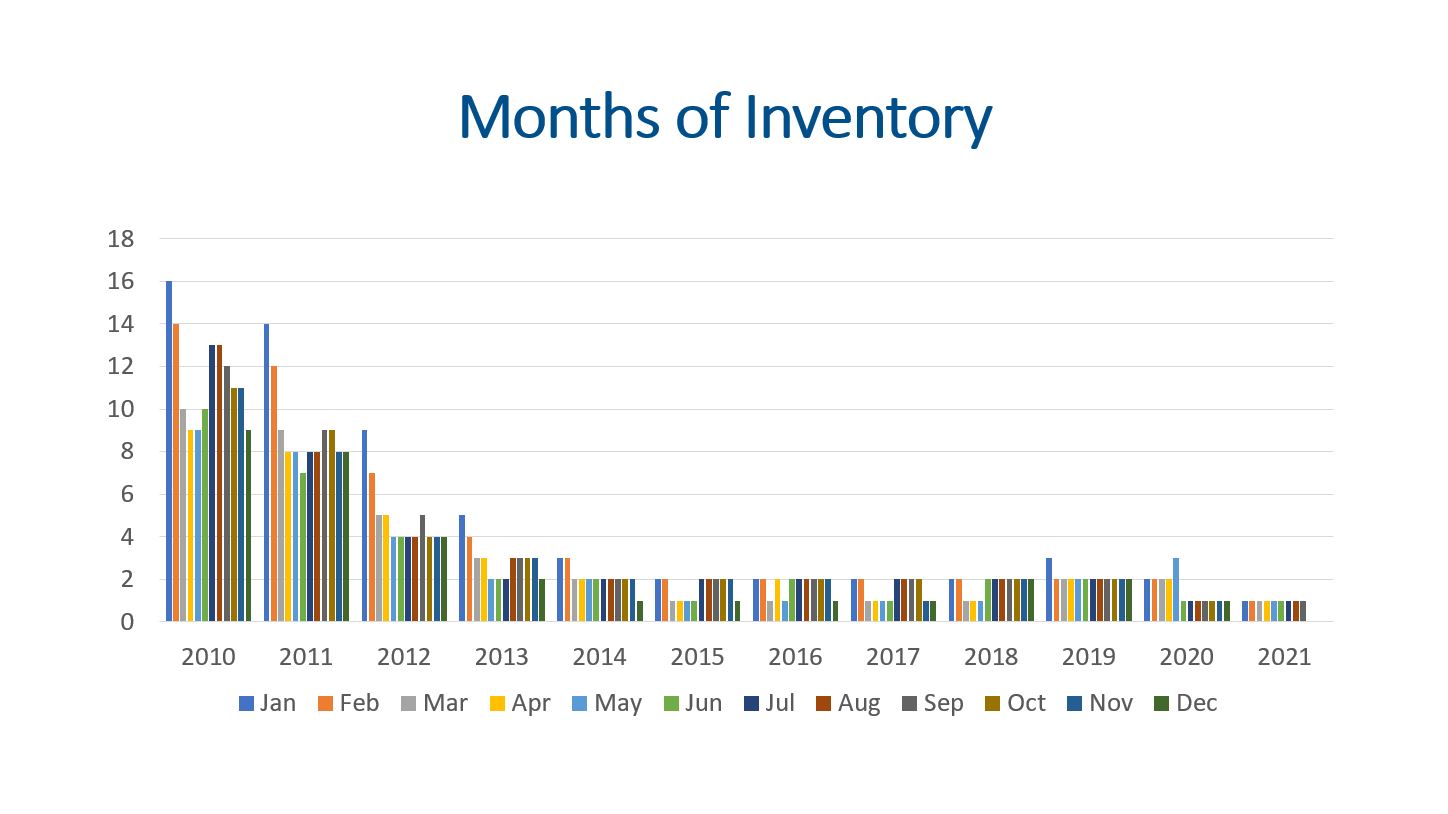 The months of inventory is a great indicator of what kind of market we are in. A seller’s market has 0-3 months of inventory. A balanced market has 4-6 months of inventory, and 7+ months of inventory is a buyer’s market.
With 4,398 listings on the market and 5,182 closings, we have 3.6 weeks of inventory. Therefore, we are still in a seller’s market.
Final Thoughts
In summary, supply, demand, median sales price, and months of inventory are all worth monitoring. Supply has been stubbornly low. Demand has been consistent with strong showings and steady increases in contracts and closings. This is why the median sales price has continued to climb. As long as the months of inventory is below 3 months, we expect prices to increase. With the significant jumps in prices over the last 18 months, we do expect appreciation to moderate some and come back to the historical average of 6% over the next 12 months. If mortgage interest rates stay low through the Federal Reserve pulling back on bond purchases, the market will fair better than if there is a sudden increase in mortgage interest rates.
Here is a link to the full presentation: