The Denver residential real estate market is still shifting. Inventory has climbed 80% since last year giving buyers a lot more options. The 30-year mortgage rate hovered in the 7% to 7.5% throughout the month. The October inflation was just reported at 7.7%, this is down from 8.2% in for September. The Federal Reserve raised the overnight funds rate another 0.75% earlier this month. It will be interesting to see what the Fed does in December and early next year. New contracts fell month over month and year over year. Let’s dive into the key market data for the Denver residential real estate market to see what is happening in supply, demand, sales prices, and months of Inventory for October 2022.
Supply
We saw 4,218 new listings during October 2022. This is down (22.7%) from the 5,458 new listings in October 2021 and down (23.2%) compared to September 2021. There is a seasonal slowdown each year but this is lower than normal.
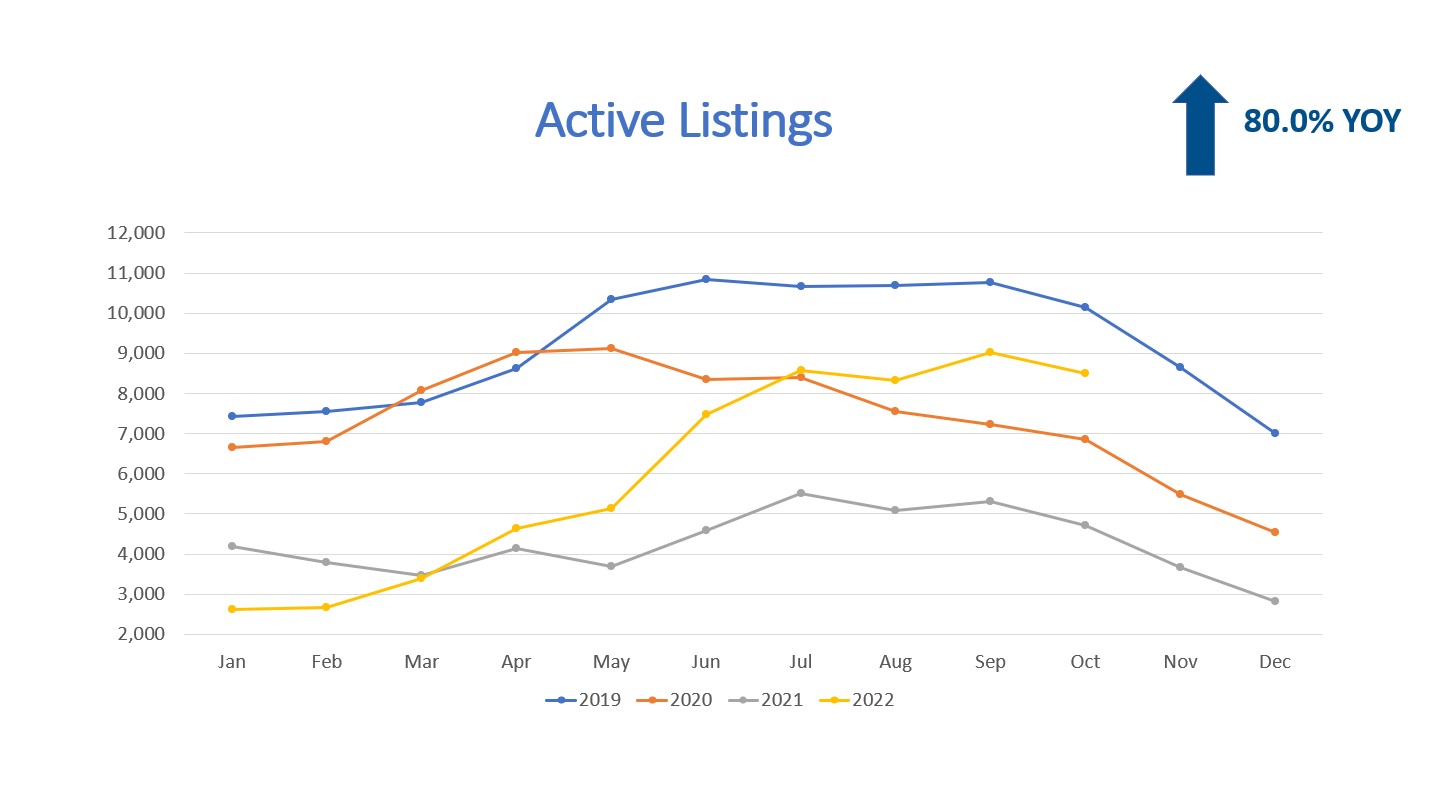 When we look at the total amount of active listings at the end of the month, we had 8,488 active listings. This is the highest level in the last two years but is still but is still lower than 2019. The inventory levels are likely to reach 2019 levels in November and will likely trend even higher in 2023. Buyers now have a lot more options when they are shopping for a home. This is markedly different from earlier this year with the bidding wars.
Year to date, detached single-family home construction starts, for the Dener Metropolitan Statistical Area (MSA), are down (13.5%) compared to 2021 but are up 2.9% compared to 2020. Home builder sentiment has hit the lowest level in the last 13 months. We believe the higher material prices, labor costs, and higher interest rates will continue to slow new construction. DR Horton is reporting a 32% cancellation rate on their homes. https://www.costar.com/article/1635361627/nations-largest-homebuilder-hit-by-effects-of-rising-interest-rates
On the multi-family front (5+ units), construction starts are down (4%) YOY and up 51.4% compared to 2020 according to Census Data. CoStar reports that Denver has 25,863 apartments under construction right now is the highest volume in 22 years.
All in all, supply for residential homes for sale is undergoing a significant change in market conditions. Let’s look at demand.
Demand
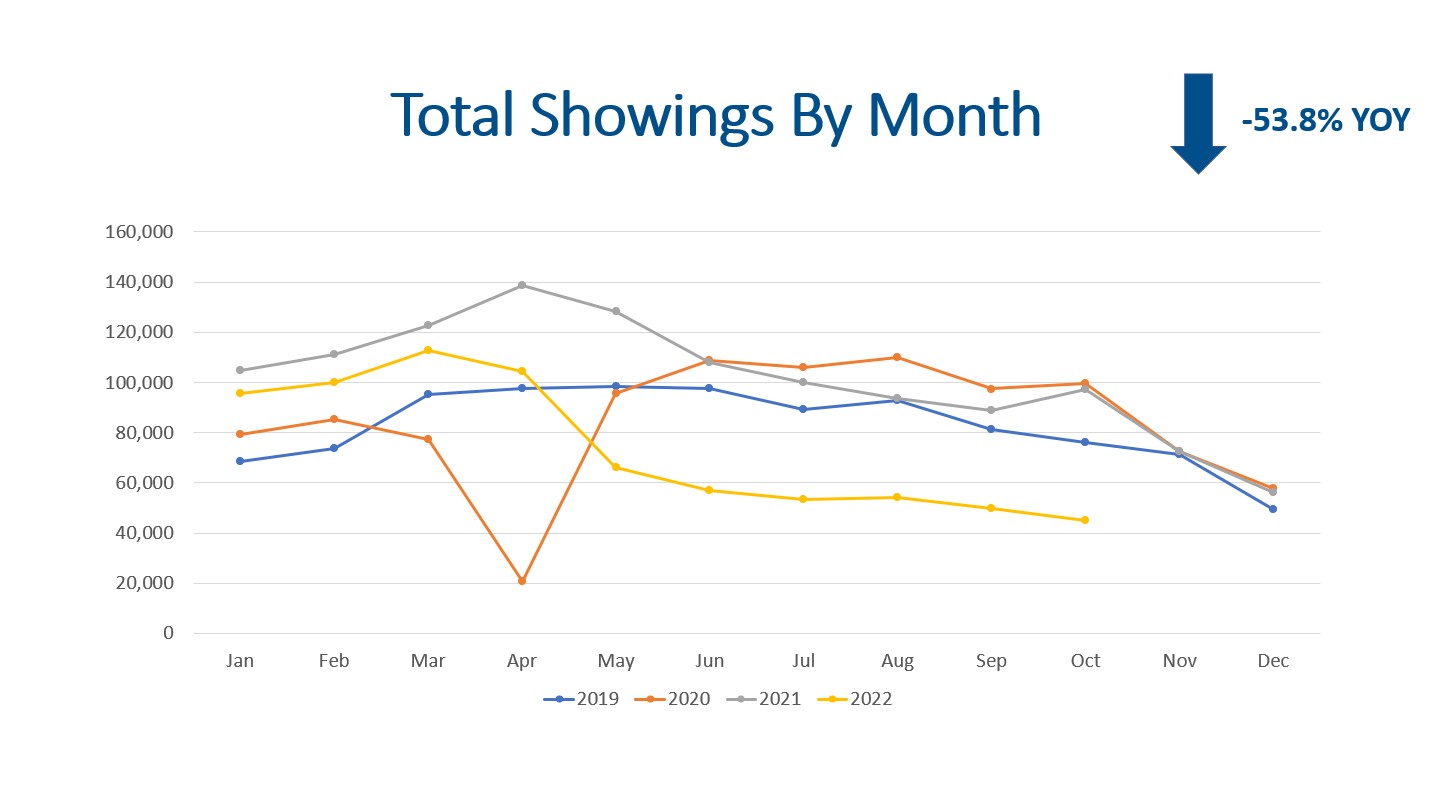
Showings are the leading indicator for contracts and closings. The average total showings for October during 2019, 2020, 2021 was 90,996. October 2022 had 44,944 showings (53.8%) lower than October 2021. High home prices, high rents, high interest rates, high inflation, and overall market uncertainty appears to have taken a large portion of buyers out of the market.
 Denver had 3,191 properties go under contract in October 2022. This is a (40%) decrease compared to October 2021 and is a (6.6%) decrease compared to September 2022.
There were 3,393 closings in October 2022 compared to 4,172 in September 2022. This is a (18.7%) decrease month over month. A year ago, we had 5,326 closings, so closing volume is down (36.3%) YOY. Year to date, there have been 43,550 closings compared to 52,350 closings during the same period in 2021. This represents an overall decline in closings of (16.8%).
The median days on market for October 2022 was 17 days. This means half of the properties listed are selling in about 2.5 weeks, which is still fast. The average marketing time is 28 days on market. We expect both of these figures to continue to increase.
In summary, demand for housing has been temporarily suppressed by the higher interest rates and market uncertainty. We believe pent up demand for housing is being created right now. When inflation comes down, we think mortgages rates will also come down. This will spur more market activity. Now let’s look at sales prices.
Sales Prices
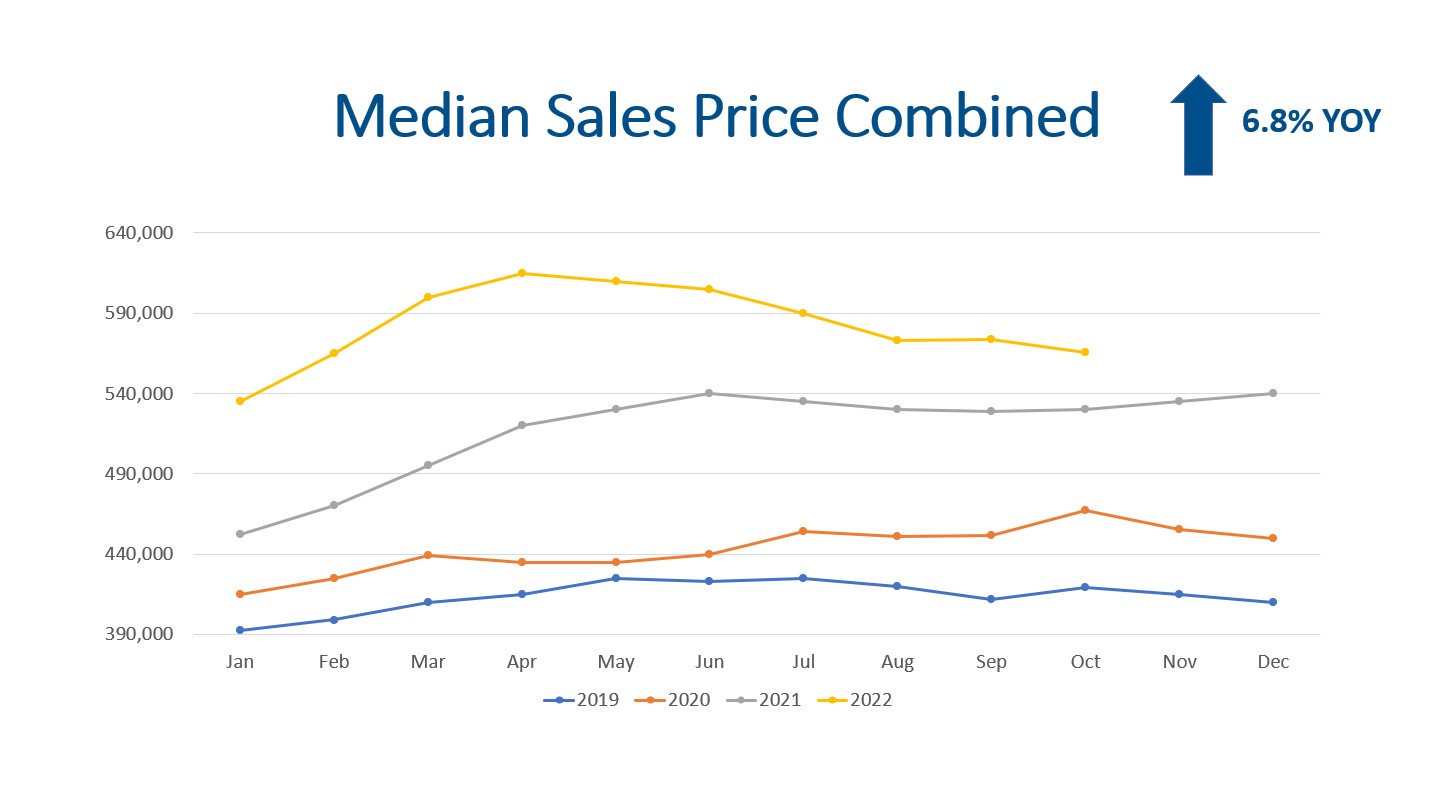
The median sales price for October was $565,820. This is close to the $573,480 in September. This metric includes detached homes, condos, and town homes.
If we look just at detached homes, the median sales price was $622,990. This is down (0.4%) from September 2022 but is 7.4% higher than October 2021.
Condos and town homes came in at $357,500 in October. This is down (2.1%) from last month but is 9% higher than October 2021.
We are very close to the long-term average appreciation rate of 6%. We expect the rate of increase to dip below the long-term average over the next six months.
In summary, sales price appreciation is moderating, which is good. Let’s look at months of inventory.
Months of Inventory
The months of inventory is a great indicator to watch for market trends. Typically, a seller’s market has 0-3 months of inventory. A balanced market has 4-6 months of inventory, and 7+ months of inventory is a buyer’s market. In a seller’s market prices go up. In a buyer’s market prices go down.
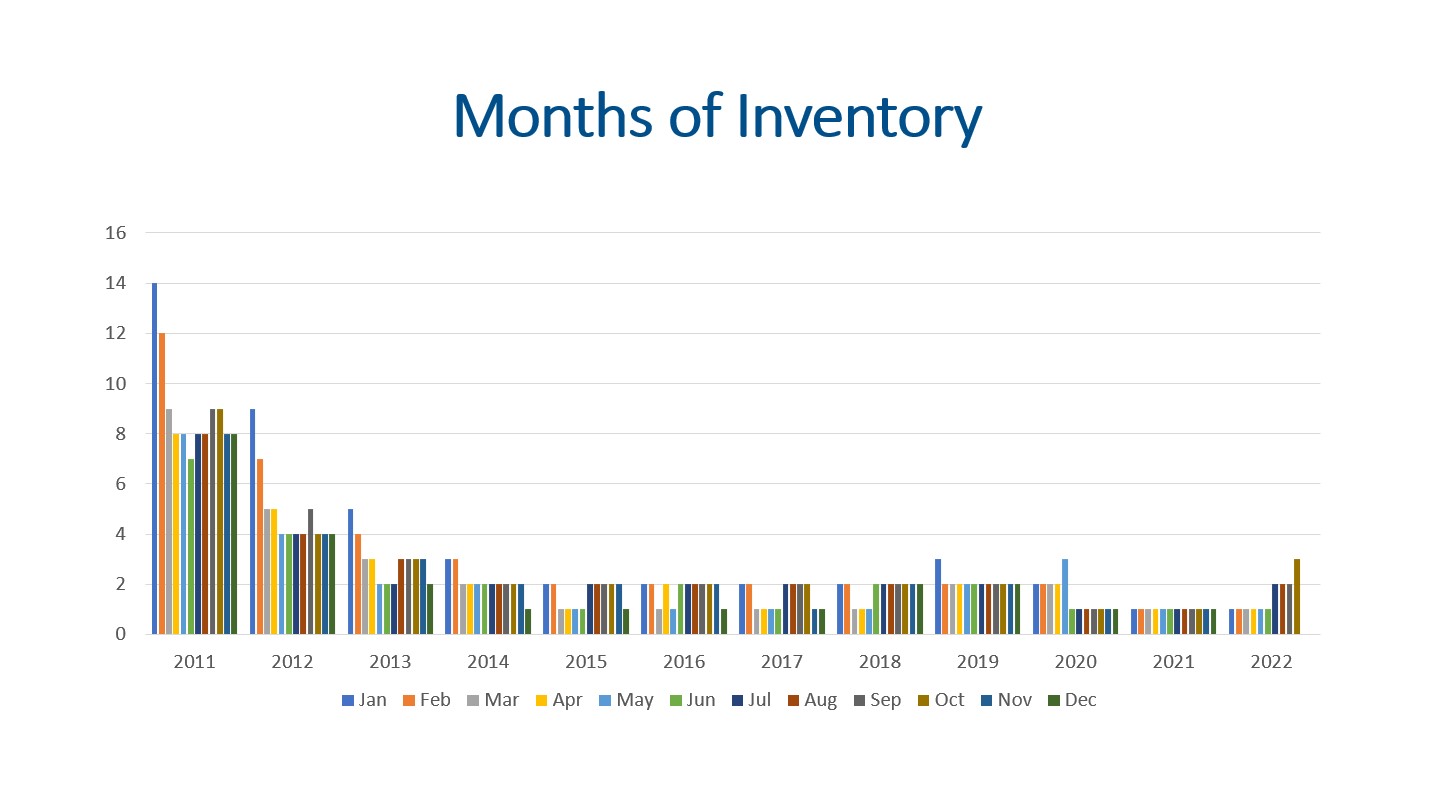
With 8,488 listings on the market and 3,393 closings, we have 10.72 weeks of inventory. This is up from the 9.27 weeks in September and up considerably from the 3.09 weeks in March of 2022.
All in all, months of inventory is steadily increasing.
Final Thoughts
In conclusion, supply, demand, sales prices, and months of inventory are all important key performance indicators worth monitoring closely. Supply has been trending higher all year, but we are still lower than 2019. Demand is weakening but properties are still selling! High prices, high rents, high interest rates, high inflation, and uncertainty in the economy is slowing showings, new contracts, and closings. The 30-year mortgage interest rate is the highest it has been since 2008. Lastly, with 10.72 weeks of inventory, annual home appreciation will continue slowing.
Here is a link to the full presentation: