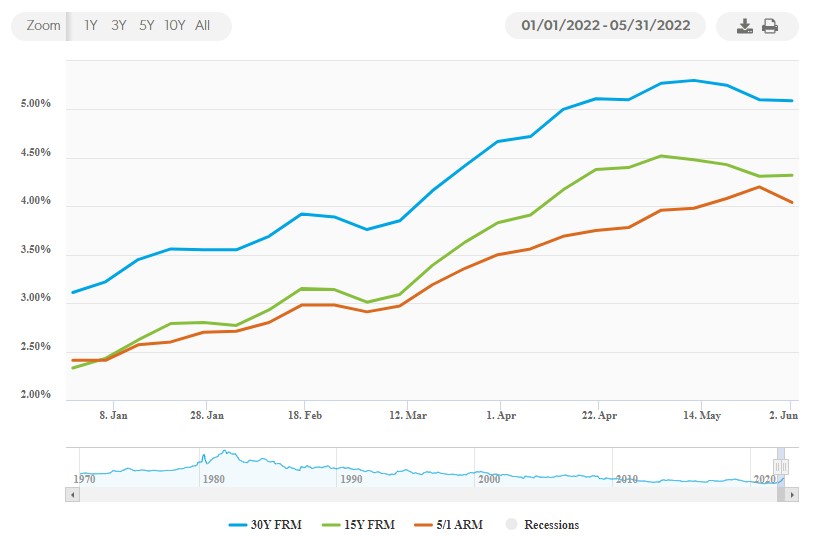
Although the residential real estate market in Denver has seen a steadily increasing inventory, we are still well below the inventory seen in 2019 and 2020. Mortgage interest rates for a 30-year mortgage ended May at 5.1%, which is very different from the 3.1% at the beginning of the year.
The increase in interest rates is coming from two policy changes. First, the Federal Reserve is no longer purchasing $80B a month of US Treasuries and $40B a month of Mortgage-Backed Securities. Second, the Federal Reserve has increased the Fed Funds rate to a target of 1.5% to 1.75%.
Next, let’s take a look at the latest market trends for the residential real estate market in Denver by examining: Supply, Demand, Sales Prices, and Months of Inventory for May 2022.
Supply
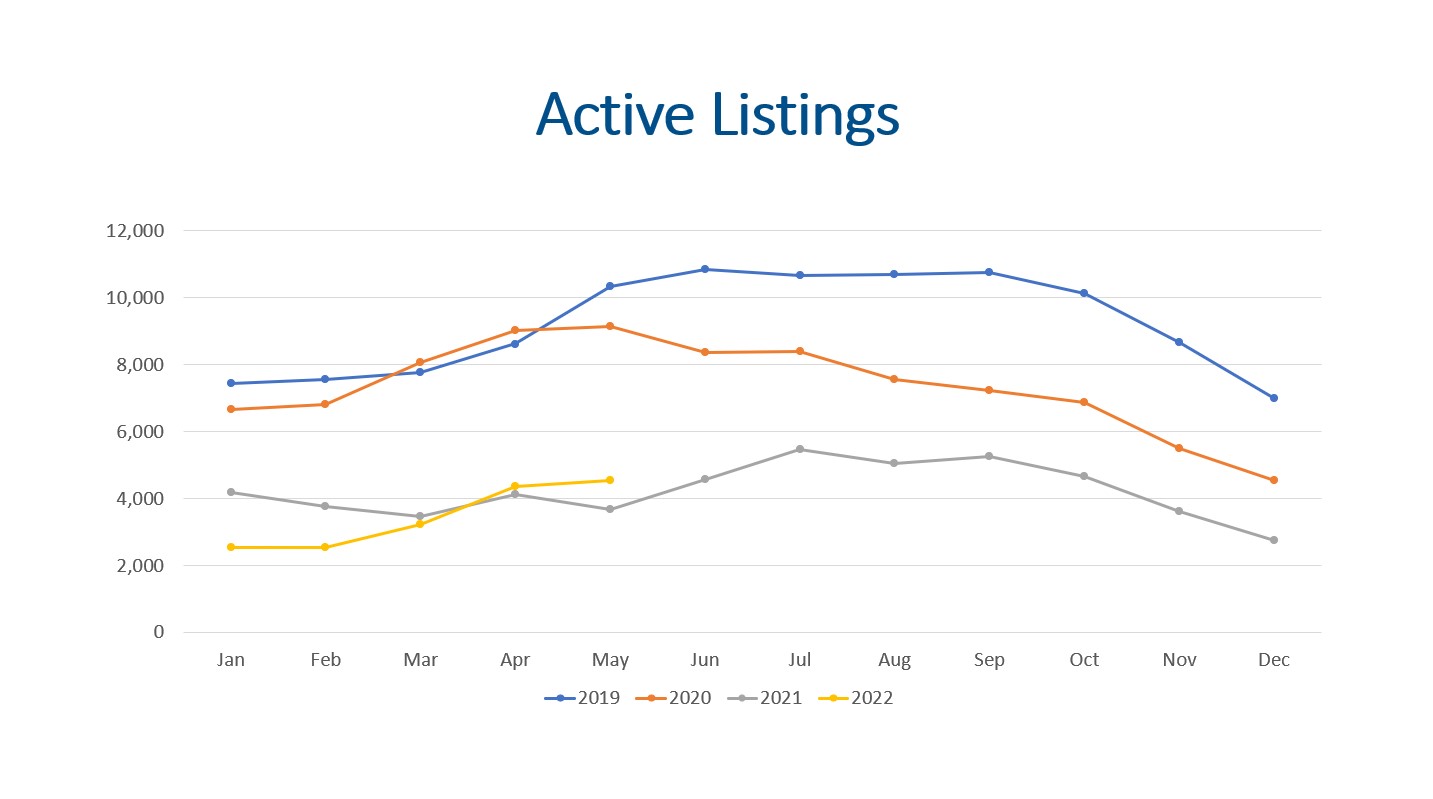 We saw 6,891 new listings during May 2022. This is 463 more new listings than May of 2021 but is still lower than the historical average of 7,187 new listings in May.
When we look at the total amount of active listings at the end of the month, we only had 4,550 active listings. This is up 4.0% from April of 2022 and up 23.8% compared to May of 2021. However, when we compare this to the long-term average of active listings it is 48.8% of what we should have for May. This is dramatically low inventory.
Year to date detached single-family home construction starts were up 31.9% for January to March when compared to 2021 but that has dropped to an increase of only 2.3% with the April data. April saw a large drop in housing starts. (This data lags by 1 month.)
All in all, supply for residential homes for sale is still very tight.
Demand
In this post, we are reporting on May results. As a side note, we are actively monitoring the June data, and we are seeing changes in the market.
The volume of showings is a great leading indicator of real estate market demand.
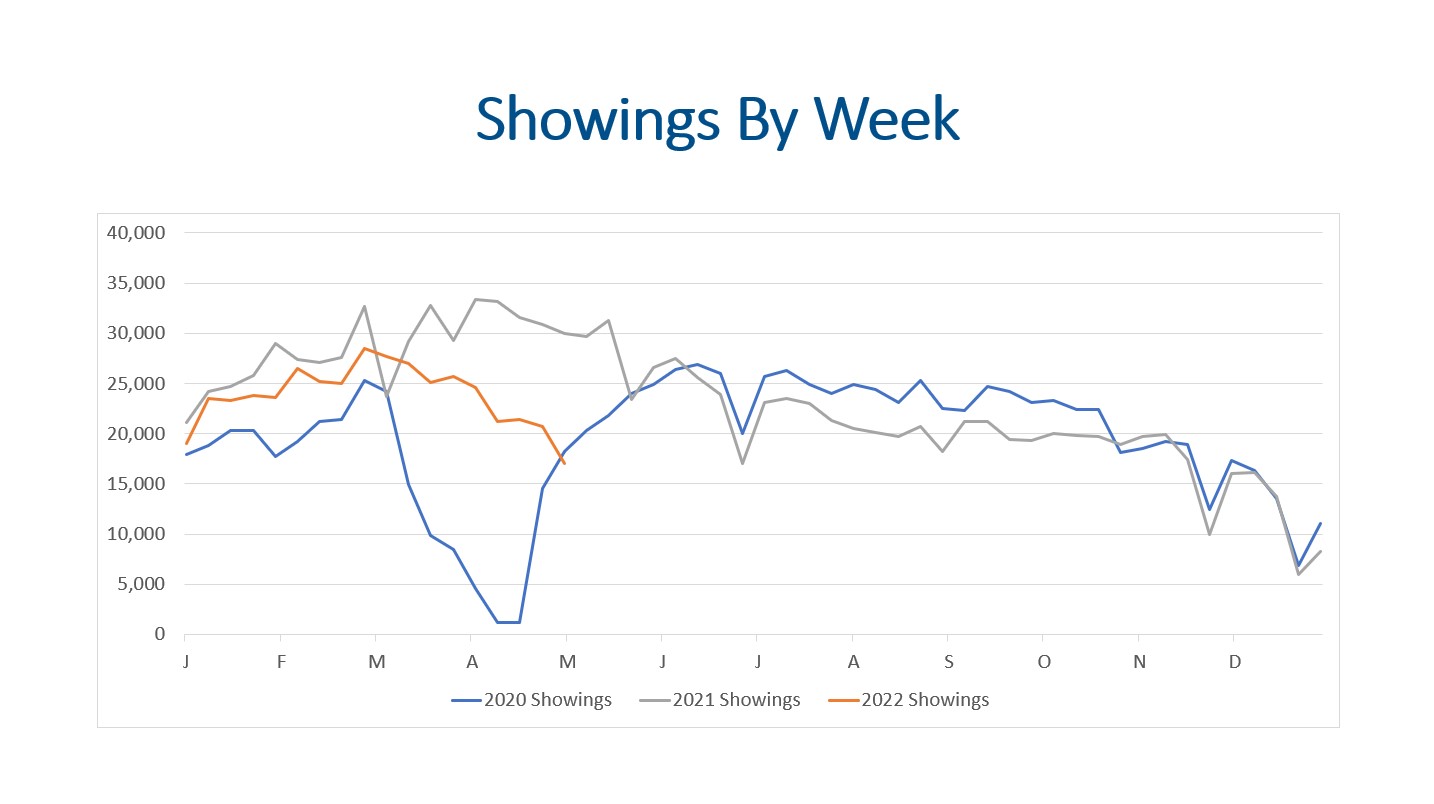 Total showings for May 2022 are lower than April 2022 by (36.6%). This is a significant decrease! The number of showings per active listing came in at 9.74, which is down from 15.61 in April 2022. The metric of showings per active listing has seen a historical slow down in late spring early summer as more properties come on the market. Buyers who have been frustrated by the bidding wars are getting some reprieve due to lower competition!
We saw 5,929 properties go under contract in May 2022. This represents a 9.7% increase from April 2022 but is (4.0%) less than May 2021.
There were 5,594 closings in May 2022 compared to 5,129 in April of 2022. This is a 9.1% month over month increase but is very close to the 5,564 closings in May of 2021. Year to date closings are down (5.8%) compared to the same period last year.
We believe the decline in closings are from the persistently low inventory, higher prices, and the higher interest rates.
 The median days on market for May 2022 remained at 4 days, so half of the homes sold within 4 days!
All in all, showings, contracts, closings, and the median days on market are all indicate we are all good measures of demand.
Sales Price
The median sales price for the residential market for May was $610,000. This is down slightly from the median sales price of $615,000 in April and represents a 15.1% increase over May 2021. This includes detached homes, condos, and town homes.
If we look just at detached homes, the median sales price was $667,000. This represents a 13.4% YOY increase.
Most of the year has seen year over year increases of 18-21% so May coming in at 15.1% shows the market is shifting some.
Months of Inventory
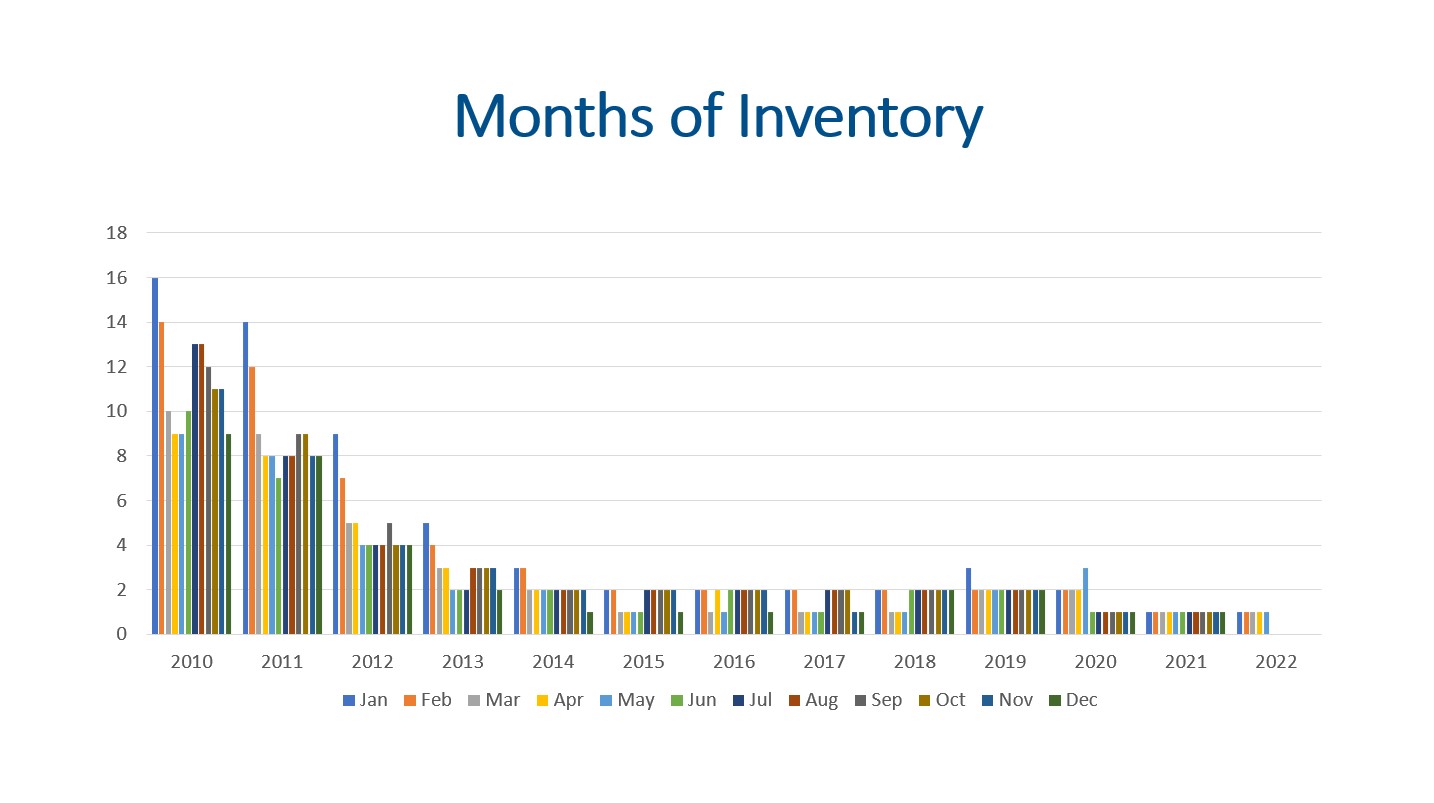 The months of inventory is still one of the best indicators to watch for market trends. A seller’s market has 0-3 months of inventory. A balanced market has 4-6 months of inventory, and 7+ months of inventory is a buyer’s market. In a seller’s market prices go up, and in a buyer’s market prices go down.
With 4,550 listings on the market and 5,594 closings, we have 3.5 weeks of inventory. This is up from the 2.8 weeks of inventory in March 2022.
Final Thoughts
In summary, supply, demand, sales prices, and months of inventory are all worth tracking closely. Supply is still a problem for Denver Residential Real Estate but it is getting a little better. At least we finally have more inventory than this time last year. More and more homes are coming on the market. Demand is strong when looking at contacts and closings but higher interest rates, high inflation, and uncertainty in the economy appears to be taking a toll on showing activity. The 30-year mortgage interest rate at the end of May was 5.1% and the rates have climbed over 6% since then. Lastly, with 3.5 weeks of inventory, home appreciation is likely to continue in 2022 but the gains are likely to pull back to single digits. With that said, the rate of appreciation is vey likely to cool.
Here is a link to the full presentation: